CIMA CO1 Official Learning System - Fundamentals of Management Accounting
Подождите немного. Документ загружается.


STUDY MATERIAL C1
90
COST–VOLUME–PROFIT ANALYSIS
The fi xed overhead absorption rate is based on the normal capacity of 2,000 units per
month. Assume that the same amount is spent each month on fi xed overheads.
Budgeted sales for next month are 2,200 units.
You are required to calculate:
(i) the breakeven point, in sales units per month;
(ii) the margin of safety for next month;
(iii) the budgeted profi t for next month;
(iv) the sales required to achieve a profi t of £96,000 in a month.
Solution
(i) The key to calculating the breakeven point is to determine the contribution per unit.
Contribution per unit £ (£ £ £ ) £
Brea
keven poin
120 22 36 14 48
tt
Fixed overhead
Contribution per unit
£
£
un
12 2 000
48
500
,
iits
(ii) Margin of safety budgeted sales breakeven point
2
200 500
1
700 1 700 2 2000 100 77
,
,,/, units (or % % of budgeteed sales)
(iii) Once breakeven point has been reached, all of the contribution goes towards profi ts
because all of the fi
xed costs have been covered.
Budgeted profit units margin of safety £ Contribu 1 700 48,tt
ion per unit
£81,600
(iv) To achieve the desired level of profi t, suffi cient units must be sold to earn a contribu-
tion which co
vers the fi xed costs and leaves the desired profi t for the month.
Number of sales units required
Fixe
d overhead desired prof
iit
Contribution per unit
(£ £
£
unit
12 2 000 96 000
48
2 500
,) ,
,ss.
4.5 Drawing a basic breakeven chart
A basic breakeven chart records costs and revenues on the vertical axis and the level of
activity on the horizontal axis. Lines are drawn on the chart to represent costs and sales
revenue. The breakeven point can be read off where the sales revenue line cuts the total
cost line.
We will use our basic example to demonstrate how to draw a breakeven chart. The data is:
Selling price £50 per unit
Variable cost £30 per unit
Fixed costs £20,000 per month
Forecast sales 1,700 units per month
91
FUNDAMENTALS OF MANAGEMENT ACCOUNTING
COST–VOLUME–PROFIT ANALYSIS
●
Step 1. Select appropriate scales for the axes and draw and label them. Your graph should fi ll as
much of the page as possible. This will make it clearer and easier to read. You can make sure
that you do this by putting the extremes of the axes right at the end of the available space.
The furthest point on the vertical axis will be the monthly sales revenue, that is,
1 700 50 85 000,, uni
ts £ £
The furthest point on the horizontal axis will be monthly sales volume of 1,700 units.
Make sure that you do not need to read data for volumes higher than 1,700 units
before you set these extremes for your scales.
●
Step 2. Draw the fi xed cost line and label it. This will be a straight line parallel to the hori-
zontal axis at the £20,000 level.
The £20,000 fi xed costs are incurred in the short term even with zero activity.
●
Step 3. Draw the total cost line and label it. The best way to do this is to calculate the
total costs for the maximum sales level, which is 1,700 units in our example. Mark this
point on the graph and join it to the cost incurred at zero activity, that is, £20,000.
90
£000
80
70
60
50
40
30
20
10
0
0 400 800 1,200
Margin of safety
Fixed cost
PROFIT
LOSS
Total cost
Sales revenue
Variable
cost
Breakeven point
Number of units
1,600
Figure 4.1 Basic breakeven chart
While you will not be required to draw a graph to scale in the assessment, you
may need to do so in your working life or in future examinations for other
subjects. Learning to draw a chart to scale will provide a fi rm foundation for your under-
standing of breakeven charts. To give yourself some practice, it would be a good idea to
follow the step-by-step guide which follows to produce your own chart on a piece of
graph paper.
£
Variable costs for 1,700 units (1,700 £30) 51,000
Fixed costs 20,000
Total cost for 1,700 units 71,000
●
Step 4. Draw the revenue line and label it. Once again, the best way is to plot the extreme
points. The revenue at maximum activity in our example is 1,700 £50 £85,000.
This point can be joined to the origin, since at zero activity there will be no sales revenue.
●
Step 5. Mark any required information on the chart and read off solutions as required. Check
that your chart is accurate by reading off the measures that we have already calculated in
this chapter: the breakeven point, the margin of safety, the profi t for sales of 1,700 units.
The completed graph is shown in Figure 4.1 .
STUDY MATERIAL C1
92
COST–VOLUME–PROFIT ANALYSIS
4.6 The contribution breakeven chart
One of the problems with the conventional or basic breakeven chart is that it is not pos-
sible to read contribution directly from the chart. A contribution breakeven chart is based
on the same principles but it shows the variable cost line instead of the fi xed cost line
( Figure 4.2 ). The same lines for total cost and sales revenue are shown so the breakeven
point and profi t can be read off in the same way as with a conventional chart. However, it
is possible also to read the contribution for any level of activity.
Using the same basic example as for the conventional chart, the total variable cost for an
output of 1,700 units is 1,700 £30 £51,000. This point can be joined to the origin
since the variable cost is nil at zero activity.
The contribution can be read as the difference between the sales revenue line and the
variable cost line.
This form of presentation might be used when it is desirable to highlight the import-
ance of contribution and to focus attention on the variable costs.
90
£000
80
70
60
50
40
30
20
10
0
0 400 800 1,200
Variable cost
PROFIT
LOSS
Total cost
Sales revenue
Fixed
cost
Contribution
Breakeven point
Number of units
1,600
Figure 4.2 Contribution breakeven chart
Your own graph should be considerably larger than this: a full A4 graph-ruled
sheet is recommended to facilitate ease of interpretation.
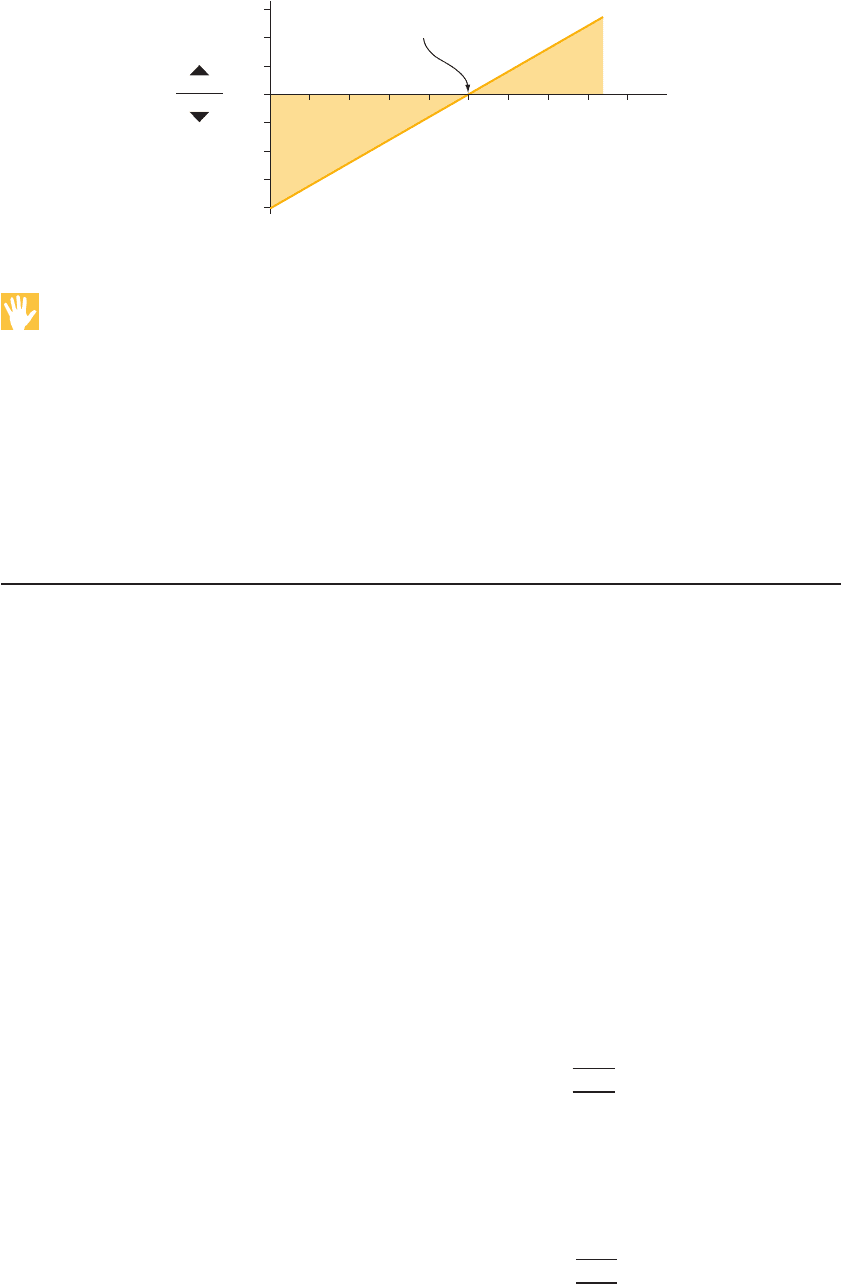
4.7 The profit–volume chart
Another form of breakeven chart is the profi t–volume chart. This chart plots a single line
depicting the profi t or loss at each level of activity. The breakeven point is where this line
cuts the horizontal axis. A profi t–volume graph for our example will look like Figure 4.3 .
The vertical axis shows profi ts and losses and the horizontal axis is drawn at zero profi t
or loss.
At zero activity the loss is equal to £20,000, that is, the amount of fi xed costs. The second
point used to draw the line could be the calculated breakeven point or the calculated profi t
for sales of 1,700 units.
The profi t–volume graph is also called a profi t graph or a contribution–volume graph.
93
FUNDAMENTALS OF MANAGEMENT ACCOUNTING
COST–VOLUME–PROFIT ANALYSIS
Exercise 4.2
Make sure that you are clear about the extremes of the profi t–volume chart axes. Practise
drawing the chart to scale on a piece of graph paper.
4.7.1 The advantage of the profit–volume chart
The main advantage of the profi t–volume chart is that it is capable of depicting clearly the
effect on profi t and breakeven point of any changes in the variables. An example will show
how this can be done.
Example
A company manufactures a single product which incurs fi xed costs of £30,000 per annum. Annual sales are
budgeted to be 70,000 units at a sales price of £30 per unit. Variable costs are £28.50 per unit.
(a) Draw a profi t–volume graph, and use it to determine the breakeven point.
The company is now considering improving the quality of the product and increasing the selling price to
£35 per unit. Sales volume will be unaffected, but fi xed costs will increase to £45,000 per annum and vari-
able costs to £33 per unit.
(b) Draw, on the same graph as for part (a), a second profi t–volume graph and comment on the results.
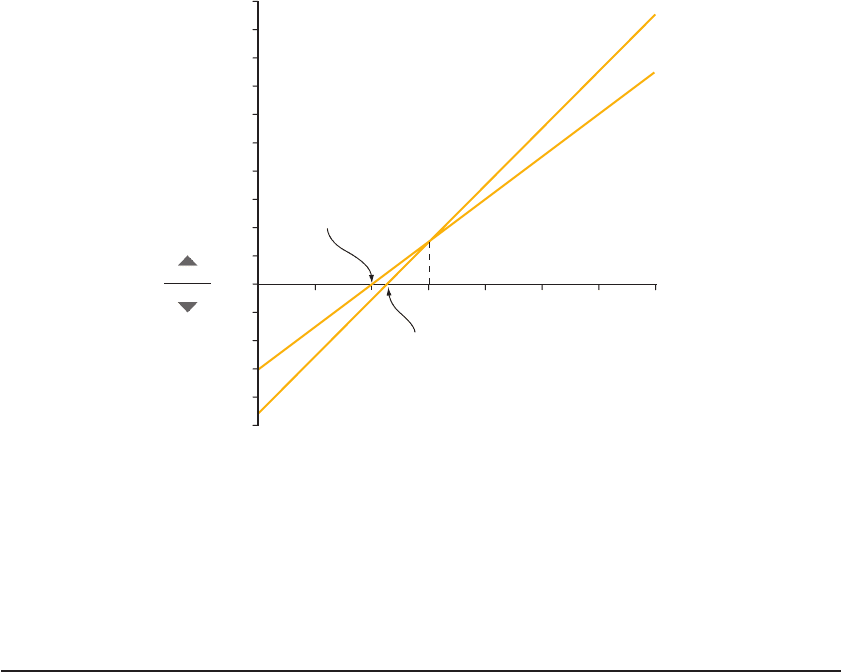
Solution
The profi t–volume chart is shown in Figure 4.4 .
The two lines have been drawn as follows:
●
Situation (a). The profi t for sales of 70,000 units is £75,000.
£000
Contribution 70,000 £(30 28.50) 105
Fixed costs 30
Profi t 75
This point is joined to the loss at zero activity, £30,000, that is, the fi xed costs.
●
Situation (b) . The profi t for sales of 70,000 units is £95,000.
£000
Contribution 70,000 £(35 33) 140
Fixed costs 45
Profi t 95
PROFIT
LOSS
£000
15
10
5
0
–5
–10
–15
–20
400 800 1,200 1,600
Number of units
Breakeven
point
Loss
Profit
Figure 4.3 Profit–volume chart
This point is joined to the loss at zero activity, £45,000, that is, the fi xed costs.
STUDY MATERIAL C1
94
COST–VOLUME–PROFIT ANALYSIS
Comment on the results. The graph depicts clearly the larger profi ts available from option (b). It also shows
that the breakeven point increases from 20,000 units to 22,500 units but that this is not a large increase when
viewed in the context of the projected sales volume. It is also possible to see that for sales volumes above
30,000 units the profi t achieved will be higher with option (b). For sales volumes below 30,000 units option (a)
will yield higher profi ts (or lower losses).
The profi t–volume graph is the clearest way of presenting information like this. If we attempted to draw two
conventional breakeven charts on one set of axes the result would be a jumble, which is very diffi cult to interpret.
4.8 The limitations of breakeven
(or CVP) analysis
The limitations of the practical applicability of breakeven analysis and breakeven charts
stem mostly from the assumptions which underlie the analysis:
(a) Costs are assumed to behave in a linear fashion. Unit variable costs are assumed to
remain constant and fi xed costs are assumed to be unaffected by changes in activity
levels. The charts can in fact be adjusted to cope with non-linear variable costs or steps
in fi xed costs but too many changes in behaviour patterns can make the charts very
cluttered and diffi cult to use.
(b) Sales revenues are assumed to be constant for each unit sold. This may be unrealistic
because of the necessity to reduce the selling price to achieve higher sales volumes.
Once again the analysis can be adapted for some changes in selling price but too many
changes can make the charts unwieldy.
(c) It is assumed that activity is the only factor affecting costs, and factors such as infl ation
are ignored. This is one of the reasons why the analysis is limited to being essentially a
short-term decision aid.
(d) Apart from the unrealistic situation of a constant product mix, the charts can only be
applied to a single product or service. Not many organisations have a single product or
service and if there is more than one, then the apportionment of fi xed costs between
them becomes arbitrary.
£000
20
30
40
50
60
70
80
90
100
10
20
30
40
50
60
70
10
0
–10
–20
–30
–40
–50
Number of units (000)
Breakeven
point (a)
Situation (b)
Situation (a)
Breakeven
point (b)
Loss
Profit
Figure 4.4 Showing changes with a profit–volume chart
95
FUNDAMENTALS OF MANAGEMENT ACCOUNTING
COST–VOLUME–PROFIT ANALYSIS
(e) The analysis seems to suggest that as long as the activity level is above the breakeven
point, then a profi t will be achieved. In reality certain changes in the cost and revenue
patterns may result in a second breakeven point after which losses are made. This situ-
ation will be depicted in the next section of this chapter.
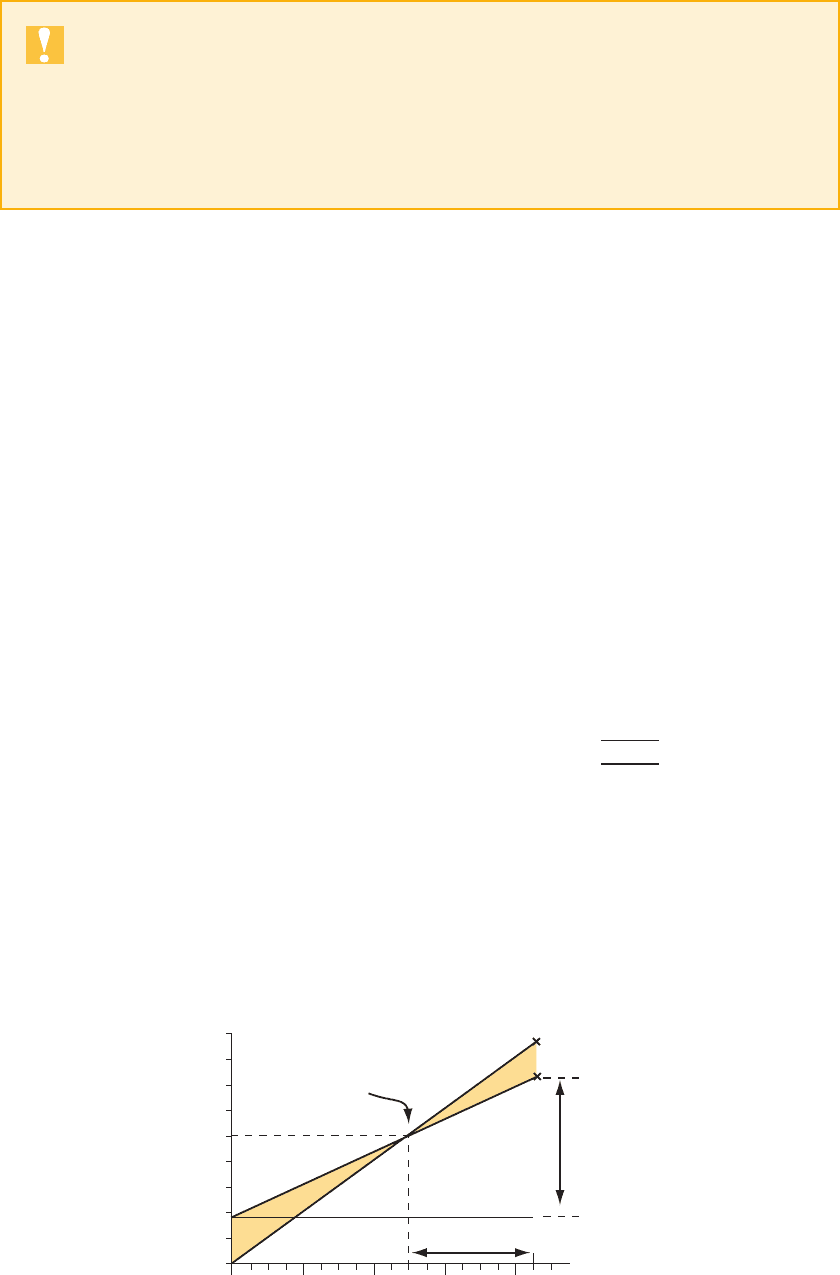
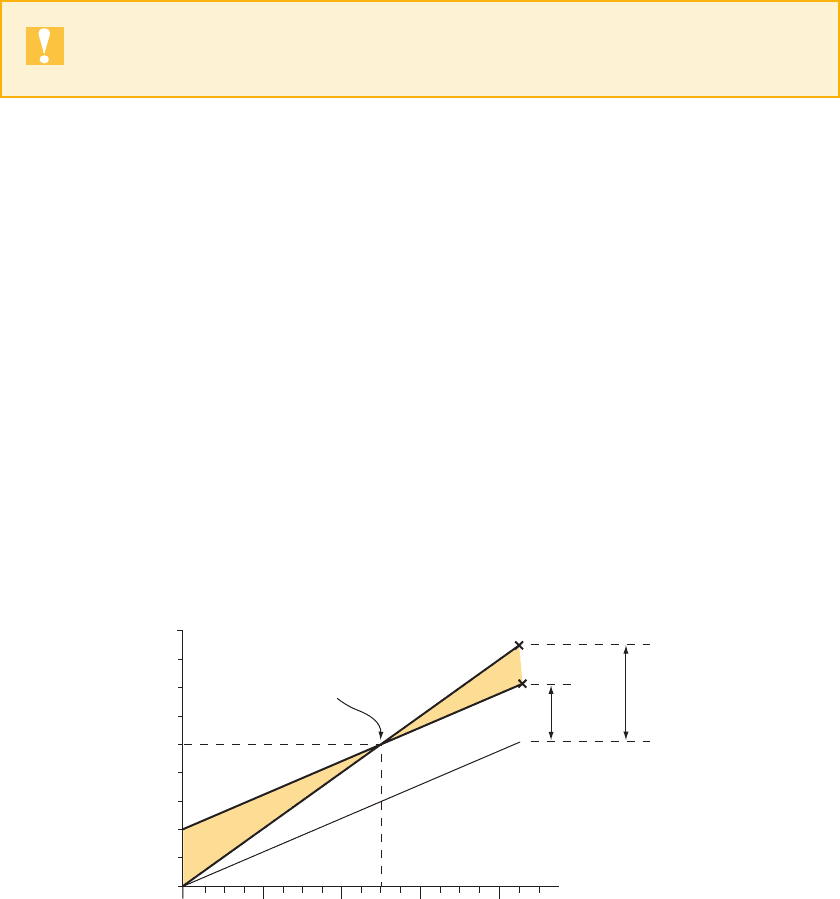
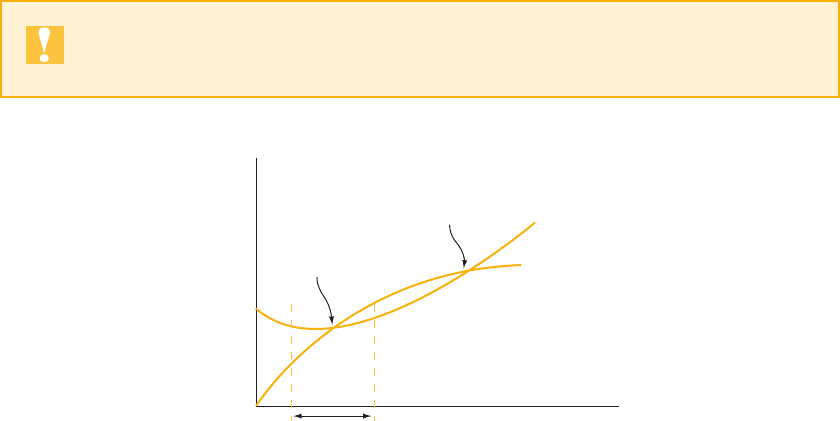
4.9 The economist’s breakeven chart
An economist would probably depict a breakeven chart as shown in Figure 4.5 .
The total cost line is not a straight line which climbs steadily as in the accountant’s
chart. Instead it begins to reduce initially as output increases because of the effect of
economies of scale. Later it begins to climb upwards according to the law of diminishing
returns.
The revenue line is not a straight line as in the accountant’s chart. The line becomes less
steep to depict the need to give discounts to achieve higher sales volumes.
However, you will see that within the middle range the economist’s chart does look very
similar to the accountant’s breakeven chart. This area is marked as the relevant range in
Figure 4.5 .
For this reason, it is unreliable to assume that the cost–volume–profi t relationships
depicted in breakeven analysis are relevant across a wide range of activity. In particular,
Figure 4.5 shows that the constant cost and price assumptions are likely to be unreliable
at very high or very low levels of activity. Managers should therefore ensure that they work
within the relevant range, that is, within the range over which the depicted cost and rev-
enue relationships are more reliable.
Relevant
range
Revenue
Total cost
Breakeven
point (2)
Breakeven
point (1)
Activity level
£000
Figure 4.5 The economist’s breakeven chart
You may recall that we discussed the relevant range in the context of cost
behaviour patterns in Chapter 1.

STUDY MATERIAL C1
96
COST–VOLUME–PROFIT ANALYSIS
4.10 Using CVP analysis to evaluate proposals
Use your understanding of breakeven analysis and cost behaviour patterns to evaluate the
proposals in the following exercise.
Exercise 4.3
A summary of a manufacturing company’s budgeted profi t statement for its next fi nancial
year, when it expects to be operating at 75 per cent of capacity, is given below.
£ £
Sales 9,000 units at £32 288,000
Less:
direct materials 54,000
direct wages 72,000
production overhead – fi xed 42,000
– variable 18,000
186,000
Gross profi t 102,000
Less: admin., selling and dist’n costs:
– fi xed 36,000
– varying with sales volume 27,000
63,000
Net profi t 39,000
It has been estimated that:
(i) if the selling price per unit were reduced to £28, the increased demand would utilise
90 per cent of the company’s capacity without any additional advertising expenditure;
(ii) to attract suffi cient demand to utilise full capacity would require a 15 per cent reduc-
tion in the current selling price and a £5,000 special advertising campaign.
You are required to :
(a) calculate the breakeven point in units, based on the original budget;
(b) calculate the profi ts and breakeven points which would result from each of the two
alternatives and compare them with the original budget.

97
FUNDAMENTALS OF MANAGEMENT ACCOUNTING
COST–VOLUME–PROFIT ANALYSIS
Solution
(a) First calculate the current contribution per unit.
£ 000 £000
Sales revenue 288
Direct materials 54
Direct wages 72
Variable production overhead 18
Variable administration etc. 27
171
Contribution 117
Contribution per unit ( 9,000 units) £13
Now you can use the formula to calculate the breakeven point.
Breakeven point
Fixed costs
Contribution per unit
££
42 000,
336 000
13
6 000
,
,
£
units
(b) A
lternative (i)
Budgeted contribution per unit £13
Reduction in selling price (£32 £28) £4
Revised contribution per unit £9
Revised breakeven point £78,000/£9 8,667 units
Revised sales volume 9,000 (90/75) 10,800 units
Revised contribution 10,800 £9 £97,200
Less fi xed costs £78,000
Revised profi t £19,200
Alternative (ii)
Budgeted contribution per unit £13.00
Reduction in selling price (15% £32) £4.80
Revised contribution per unit £8.20
Revised breakeven point
££
£
78 000 5 000
820
,,
.
10,122 units
Revised sales volume 9,000 units (100/75) 12,000 units
Revised contribution 12,000 £8.20 £98,400
Less fi xed costs £83,000
Revised profi t £15,400
Neither of the two alternative proposals is worthwhile. They both result in lower fore-
cast profi ts. In addition, they will both increase the breakeven point and will therefore
increase the risk associated with the company’s operations.
This exercise has shown you how an understanding of cost behaviour patterns and the
manipulation of contribution can enable the rapid evaluation of the fi nancial effects of a

STUDY MATERIAL C1
98
COST–VOLUME–PROFIT ANALYSIS
proposal. We can now expand it to demonstrate another aspect of the application of CVP
analysis to short-term decision-making.
Exercise 4.4
The manufacturing company decided to proceed with the original budget and has asked
you to determine how many units must be sold to achieve a profi t of £45,500.
Solution
Once again, the key is the required contribution. This time the contribution must be suf-
fi cient to cover both the fi xed costs and the required profi t. If we then divide this amount
by the contribution earned from each unit, we can determine the required sales volume.
Required sales
F
ixe
d costs required profit
Contribution per
unit
(£42,000 £ £
£
units
36 000 45 500
13
9 500
,,)
,
A limiting factor is any factor which is in scarce supply and which stops the
organisation from expanding its activities further, that is, it limits the organi-
sation’s activities.
4.11 Limiting factor analysis
The limiting factor for many trading organisations is sales volume because they can-
not sell as much as they would like. However, other factors may also be limited, especially
in the short term. For example, machine capacity or the supply of skilled labour may be
limited for one or two periods until some action can be taken to alleviate the shortage.
The concept of contribution can be used to make decisions about the best use of a
limited resource.
4.11.1 Decisions involving a single limiting factor
If an organisation is faced with a single limiting factor, for example machine capacity, then
it must ensure that a production plan is established which maximises the profi t from the
use of the available capacity. Assuming that fi xed costs remain constant, this is the same as
saying that the contribution must be maximised from the use of the available capacity. The
machine capacity must be allocated to those products which earn the most contribution
per machine hour.
This decision rule can be stated as ‘ maximising the contribution per unit of limiting
factor ’ .

99
FUNDAMENTALS OF MANAGEMENT ACCOUNTING
COST–VOLUME–PROFIT ANALYSIS
Example
LMN Ltd manufactures three products L, M and N. The company which supplies the two raw materials which are
used in all three products has informed LMN that their employees are refusing to work overtime. This means that
supply of the materials is limited to the following quantities for the next period:
Material A 1,030 kg
Material B 1,220 kg
No other source of supply can be found for the next period.
Information relating to the three products manufactured by LMN Ltd is as follows:
LM N
Quantity of material used per unit manufactured:
Material A (kg) 214
Material B (kg) 537
Maximum sales demand (units) 120 160 110
Contribution per unit sold £15 £12 £17.50
Owing to the perishable nature of the products, no fi nished goods are held.
Requirements
(a) Recommend a production mix which will maximise the profi ts of LMN Ltd for the forthcoming period.
(b) LMN Ltd has a valued customer to whom they wish to guarantee the supply of 50 units of each product next
period. Would this alter your recommended production plan?
Solution
(a) The fi rst step is to check whether the supply of each material is adequate or whether either or both of them
represent a limiting factor.
L M N Total
Maximum sales demand (units) 120 160 110
Material A required per unit (kg) 214
Total material A required (kg) 240 160 440 840
Material B required per unit (kg) 537
Total material B required (kg) 600 480 770 1,850
There will be suffi cient material A to satisfy the maximum demand for the products but material B will be a
limiting factor.
The next step is to rank the products in order of their contribution per unit of limiting factor. The available
material B can then be allocated according to this ranking.
LM N
Contribution per unit sold £15 £12 £17.50
Material B consumed (kg) 537
Contribution per kg of material B £3 £4 £2.50
Ranking 2 1 3
The available material B will be allocated to the products according to this ranking, to give the optimum
production plan for the next period.