Catuneanu O. Principles of Sequence Stratigraphy
Подождите немного. Документ загружается.

100 3. ACCOMMODATION AND SHORELINE SHIFTS
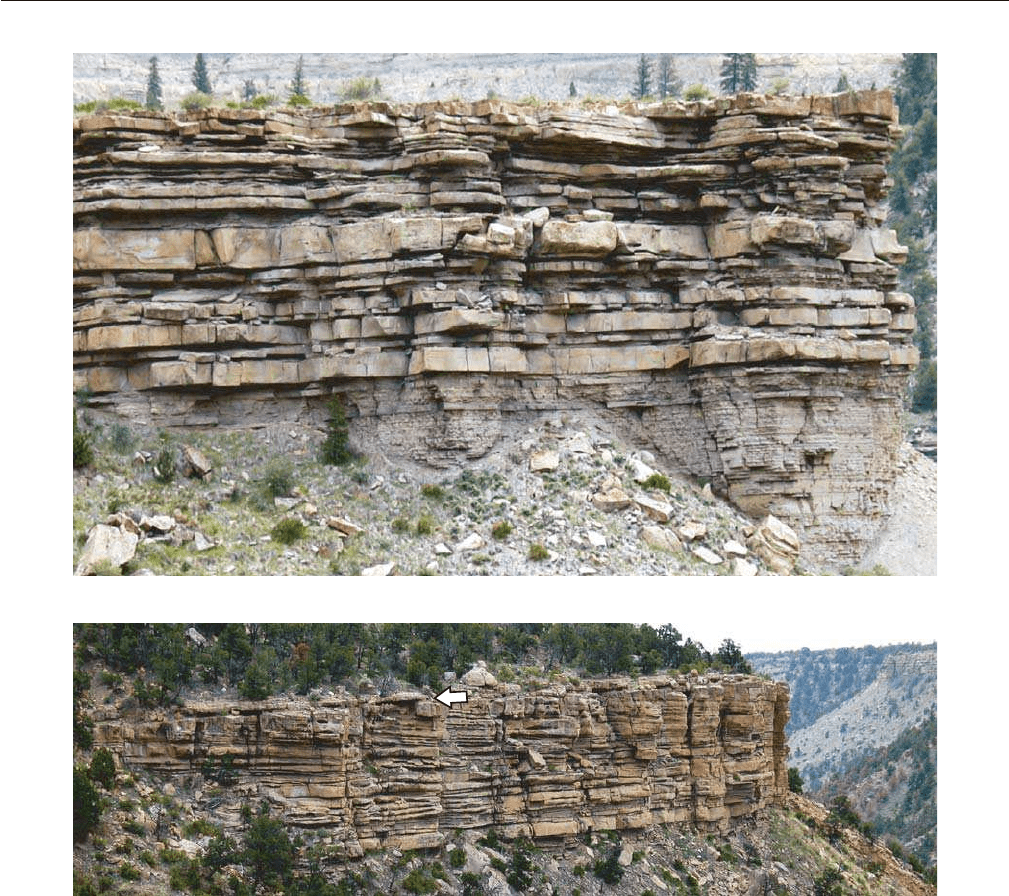
FIGURE 3.30 Forced regressive, river-dominated deltaic succession (Panther Tongue, Utah). A—conformable
shift of facies from prodelta to the overlying delta front deposits. The delta front sands are
‘gradationally based’, as no wave scouring took place during the progradation of the delta; B—relatively
steep delta front clinoforms (dipping to the right in the photograph, at an angle of 5–15°). As the
clinoforms are steeper than the wave equilibrium profile (approximately 0.3°), no wave scouring took
place during the progradation of the delta. The delta front succession is topped by a transgressive lag
(sandstone layer—see arrow), which in turn is overlain by transgressive shale. Hence, no delta plain deposits
are present.
A
B
which may be attached vs. detached, stepped-topped vs.
smooth-topped, and spread over short or long distances
(Fig. 3.33). Criteria for the recognition of shallow-marine
forced regressive deposits in outcrop, core, well logs and
seismic data are also provided by Posamentier and
Morris (2000). Perhaps the most important defining
signature of coastal to shallow-marine forced regressive
deposits is their offlapping (seaward downstepping)
character, which is caused by the fall in relative sea level
(Fig. 3.27). This stratal stacking pattern may be observed
on seismic lines (Fig. 3.22), and it is particularly signifi-
cant for the exploration of age-equivalent deep-water
SHORELINE TRAJECTORIES 101
reservoirs (more details on this topic are presented in
Chapters 5 and 6). Offlapping forced regressive deposits
may also be observed in modern environments, such as
for example in areas that are currently subject to post-
glacial isostatic rebound at a rate that exceeds the pres-
ent day rate of sea-level rise (Fig. 3.34).
Normal Regressions
Normal regressions occur during early and late stages
of base-level rise, when sedimentation rates outpace the
low rates of base-level rise at the shoreline (Fig. 3.19).
In this case, the newly created accommodation is totally
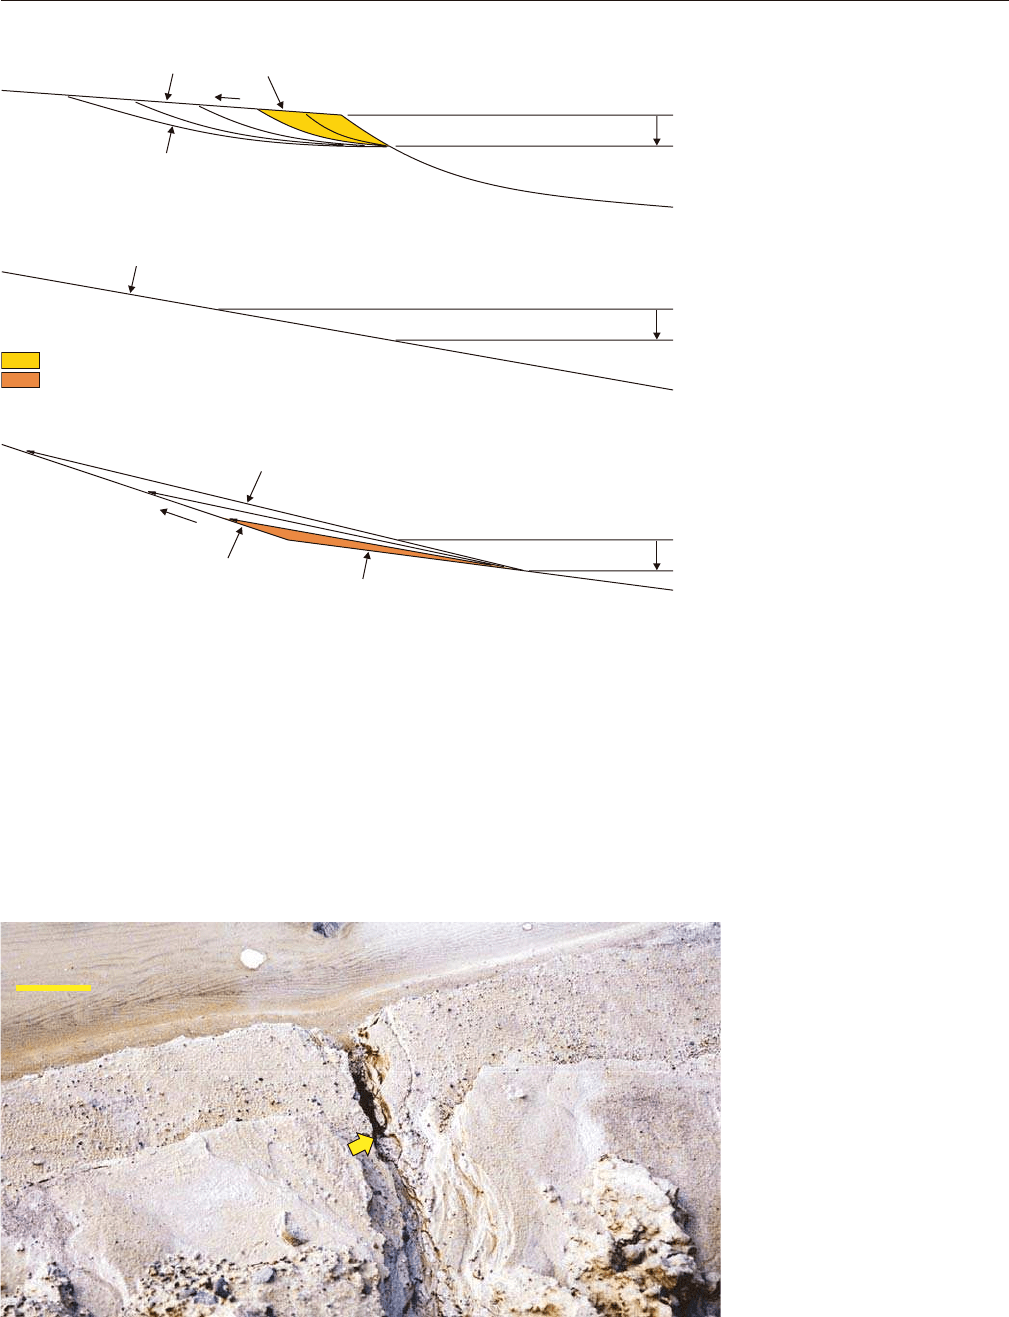
20 cm
FIGURE 3.32 Upstream-migrating
fluvial knickpoint (arrow) along a
small-scale, actively incising ‘valley’.
Note the decrease in the elevation of
the ‘coastal plain’ as a result of base-
level fall. The older coastal plain,
which existed during the early stage
of incision, is now preserved as a
stranded terrace.
Base level (T1)
Base level (T1)
Base level (T2)
Base level (T2)
Base level (T2)
Base level (T1)
Fluvial graded profile (T2)
Fluvial graded profile (T1)
Fluvial graded profile (T1)
Fluvial graded profile (T2)
Fluvial graded profile (T1, T2)
K2
K2
K3
K3
K4
K4
K5
K6
fluvial erosion at time 4
fluvial aggradation at time 3
shoreline position at time T1 (becomes first knickpoint at time T2)
K2
Sea floor at time T1
A
B
C
FIGURE 3.31 Fluvial responses to base-
level fall, as a function of the contrast in slope
gradients between the fluvial and the seafloor
profiles at the onset of forced regression
(modified from Summerfield, 1985; Pitman
and Golovchenko, 1988; Butcher, 1990;
Schumm, 1993; Posamentier and Allen, 1999;
Blum and Tornqvist, 2000). A—fluvial inci-
sion; B—fluvial bypass; C—fluvial aggrada-
tion. Knickpoints (K) mark abrupt changes in
the gradient of fluvial profiles. A downstream
increase in slope gradient (and corresponding
fluvial-energy flux) is prone to fluvial erosion
(case A). A downstream decrease in slope
gradient (and corresponding fluvial-energy
flux) is prone to fluvial aggradation (case C).
Knickpoints migrate upstream with time,
resulting in a landward expansion of the
subaerial unconformity (case A) or in a back-
fill of the landscape to the level of the new
graded profile, accompanied by fluvial onlap
of the old graded profile (case C). Case A is
most likely, case C is least likely. Case B may
describe the forced regression across a conti-
nental shelf, where minor fluvial incision (or
aggradation) may still occur below the seis-
mic resolution.
102 3. ACCOMMODATION AND SHORELINE SHIFTS
consumed by sedimentation, aggradation is accompa-
nied by sediment bypass (the surplus of sediment for
which no accommodation is available), and a progra-
dation of facies occurs (Fig. 3.35). Such seaward shifts
of facies result in the formation of conformable succes-
sions, which consist typically of coarsening-upward
shallow-marine deposits topped by coastal to fluvial
facies (Fig. 3.36). Normal regressive successions may
develop in both river-mouth (deltaic) and open coast-
line settings. In the former case, the vertical profile
records a shift from prodelta, to delta front and delta
plain facies (Fig. 3.36), whereas in the latter setting the
change is from shelf to shoreface and overlying beach
and alluvial facies (Figs. 3.37 and 3.38).
The dip angle of the prograding clinoforms (Fig. 3.35)
depends on the dominant controls on sediment
distribution in the subtidal area, as well as on sediment
supply. In the case of wave-dominated open coastlines,
or wave-dominated deltas, the angle of repose is very
low, averaging 0.3° (mean gradient of the wave equi-
librium profile). This angle is steeper in the case of
river-dominated deltas, ranging from less than a degree
(where rivers bring a significant amount of fine-grained
suspension load, and the sediment transport in the
delta front environment is primarily attributed to low-
density turbidity flows) to approximately 30° (Gilbert-
type deltas, where the riverborne sediment is dominantly
sandy and its transport within the delta front environ-
ment is largely linked to the manifestation of grain
flows). In either case, the creation of accommodation
in the coastal and adjacent fluvial and shallow-marine
regions is prone to aggradation along the entire
nearshore profile, and hence no significant fluvial or
wave scouring are expected to be associated with this
type of shoreline shift (Fig. 3.35). As a result, normal
regressive shoreface or delta front deposits are grada-
tionally based (Fig. 3.36), in contrast with the forced
regressive shoreface or wave-dominated delta front
facies which are sharp-based (Figs. 3.27 and 3.28).
The process of coastal aggradation, in response to
rising base level, also confers another important diagnos-
tic feature that separates normal regressive from forced
regressive deposits (Figs. 3.27 and 3.35). As accommoda-
tion is positive in the coastal region, a topset of intertidal
to supratidal deposits (delta plain in river-mouth
settings, Fig. 3.36; or beach/strandplain sediments
in open shoreline settings, Fig. 3.38) accumulates and
progrades on top of the shallow-marine delta front/
shoreface facies (Fig. 3.35). Such a topset is absent in the
case of forced regressions, where the subtidal facies
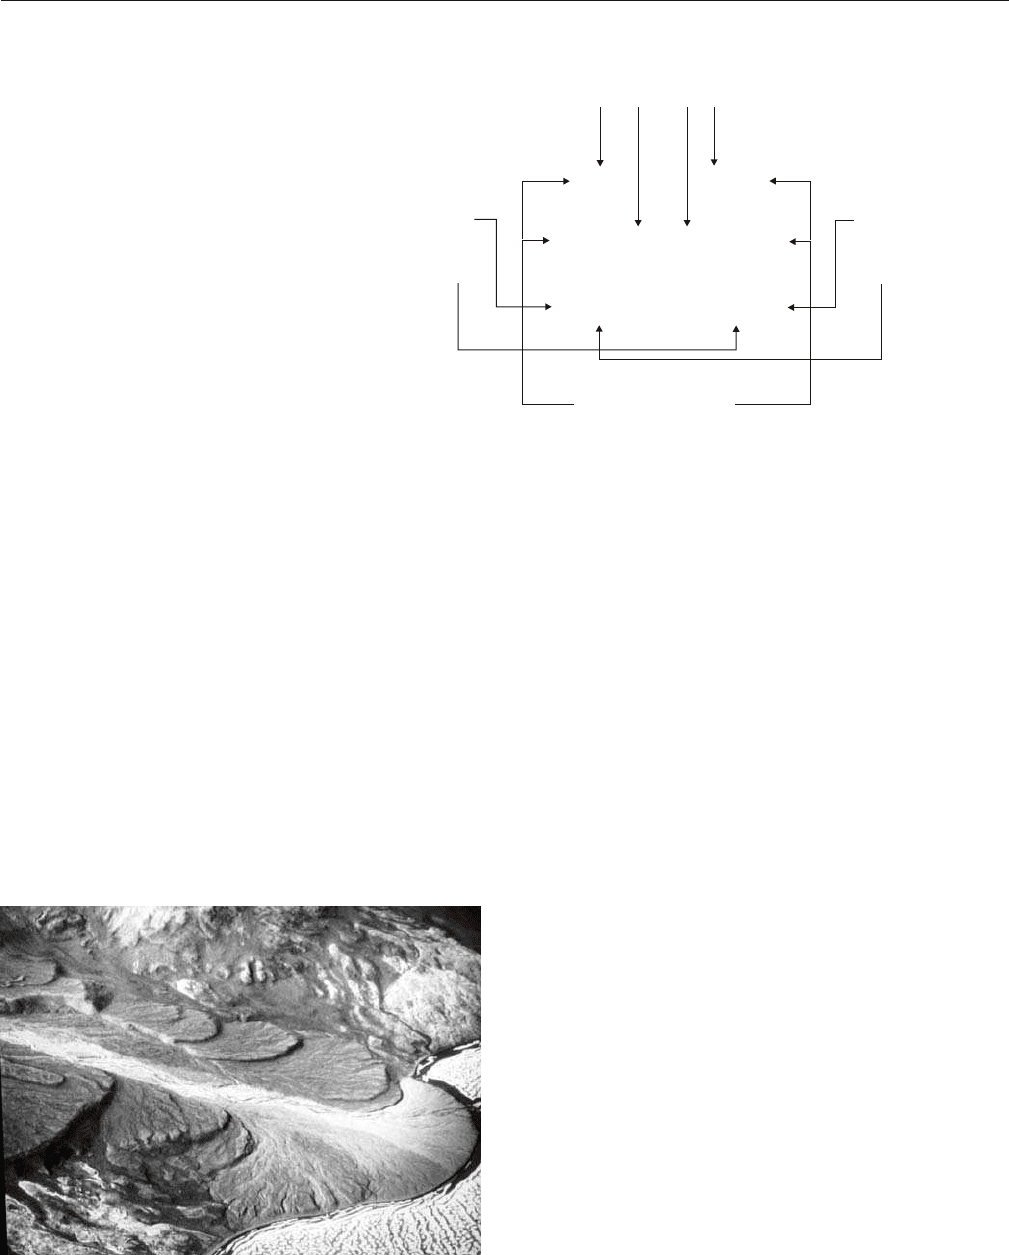
FIGURE 3.34 Modern forced regressive delta showing offlapping
stratal stacking patterns (photo courtesy of J. England). In this case,
the fall in base level is triggered by post-glacial isostatic rebound in
the Canadian arctics, at a rate that exceeds the rate of present day
sea-level rise.
Sea floor
gradient
Attached Detached
Smooth-topped
Stepped-topped
Long distance
regression
Short distance
regression
Sediment supply
Uniform
Variable
Rates of base-level fall
Uniform
Variable
Rates of
base-level fall
High
High
Low
Low
FIGURE 3.33 Stratal architecture of shallow-
marine forced regressive deposits, as a function
of sediment supply, rates of base-level fall and
gradient of the seafloor. The interplay of these
variables may result in a variety of possibilities,
with the prograding forced regressive lobes
being attached or detached, stepped-topped or
smooth-topped, and spread over short or long
distances (see Posamentier and Morris, 2000,
for a more detailed discussion).
SHORELINE TRAJECTORIES 103
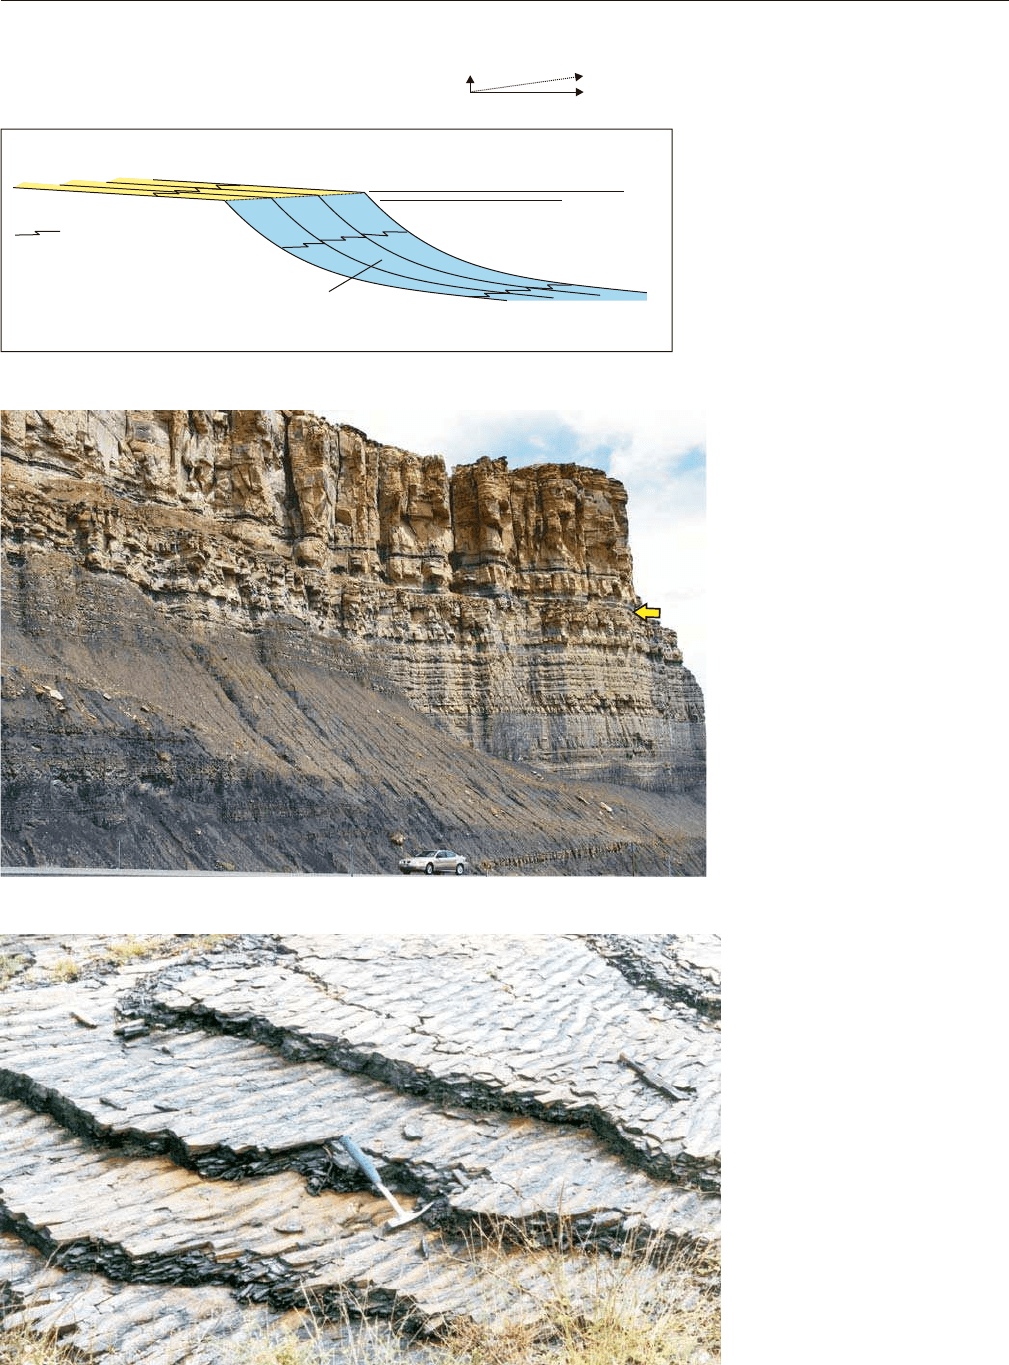
FIGURE 3.36 Normal regressive
deltaic succession (river-dominated
delta), showing a conformable transi-
tion from shallow-marine muds and
sands (shelf, prodelta, delta front) to
coastal and fluvial deposits (Ferron
Sandstone, Utah). The arrow points at
the conformable facies contact between
delta front sands and the overlying
coal-bearing delta plain and fluvial
facies. This facies contact marks the
base of the deltaic topset (Fig. 3.35).
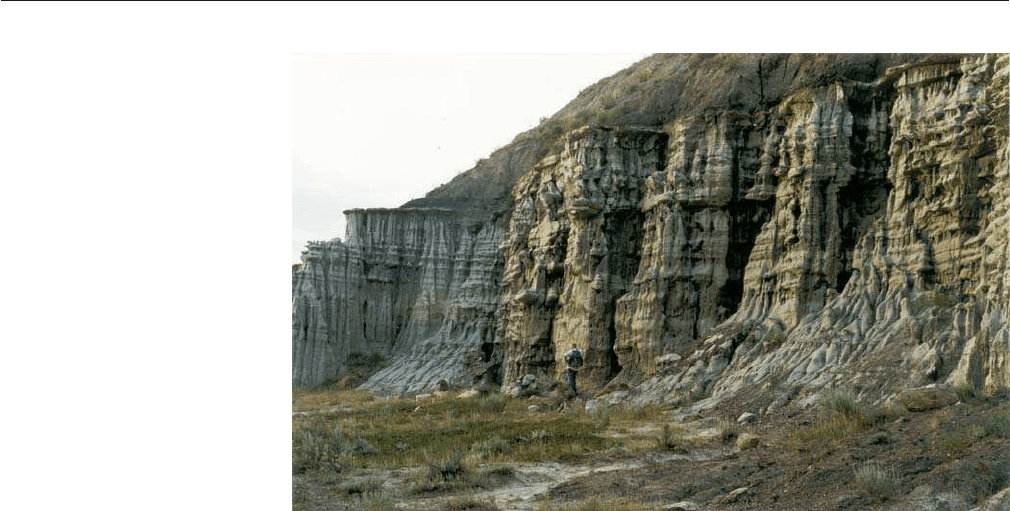
FIGURE 3.37 Aggrading upper
shoreface sandstones in a wave-
dominated open coastline setting.
These wave ripple-marked strata
are interpreted as part of a late rise
(highstand) normal regressive
systems tract (Rubidge et al., 2000).
Waterford Formation (Late Permian),
Ecca Group, Karoo Basin.
aggradation
progradation
(1)
(1)
(2)
(3)
(4)
(4)
base-level rise
Normal regressions:
shoreline shift
Foreset: shoreface/delta front
aggradation and progradation
Topset: fluvial/delta plain/strandplain
lateral changes
of facies
Bottomset:
prodelta/shelf
downlap
FIGURE 3.35 Shoreline trajectory in
normal regressive settings, defined by a
combination of progradation and aggrada-
tion in fluvial to shallow-marine systems.
Normal regressions are driven by sediment
supply, where the rates of base-level rise at
the shoreline are outpaced by sedimentation
rates. Normal regressions occur during early
and late stages of base-level rise, when the
rates of creation of accommodation are low
(Fig. 3.19). Progradation rates are generally
low. Normal regressions are prone to aggra-
dation in fluvial, coastal (delta plains in
river-mouth settings, or strandplains along
open shorelines), and marine environments.
104 3. ACCOMMODATION AND SHORELINE SHIFTS
offlap and are truncated by processes of subaerial
erosion (Fig. 3.27). The thickness of topset successions
varies with the case study, depending on the duration
of normal regression, the rates of coastal aggradation,
and available sediment supply. The topset may be
identified in core or outcrop based on facies analysis,
but its recognition on seismic lines as a distinct unit
may or may not be possible, depending on seismic
resolution relative to the unit’s thickness (Fig. 3.22).
The surface that separates the topset package from the
underlying subtidal deposits is always represented by a
conformable (and diachronous, with the rate of shoreline
regression) facies contact (dotted line in Fig. 3.35;
Fig. 3.36). The upper boundary of the topset unit may
also be conformable, where no subsequent erosion
reworks it (e.g., in the case of early rise ‘lowstand’
normal regressions, where the topset is overlain by
transgressive fluvial and/or estuarine strata), but often
it is scoured by subaerial erosion (e.g., late rise ‘high-
stand’ topsets truncated by subaerial unconformities)
or transgressive reworking (e.g., early rise ‘lowstand’
topsets truncated by tidal- or wave-ravinement
surfaces). The preservation potential of topset pack-
ages is higher in the case of early rise (‘lowstand’)
normal regressive deposits, as the creation of
accommodation continues following the maximum
regression of the shoreline, and lower in the case of
late rise (‘highstand’) normal regressive successions
which are followed by stages of base-level fall and
potential subaerial erosion.
FIGURE 3.38 Aggrading beach
deposits in a normal regressive
setting. The sands are massive, with
low-angle stratification, typical of
foreshore open-shoreline systems.
The beach sands overlie coarsening-
upward shelf to shoreface deposits
(in subsurface in this particular loca-
tion), and are overlain by fluvial
floodplain facies. The latter contact is
sharp but conformable. Uppermost
Bearpaw Formation sands (Early
Maastrichtian), Castor area, Western
Canada Sedimentary Basin.

CHAPTER
105
4
Stratigraphic Surfaces
INTRODUCTION
Stratigraphic surfaces mark shifts through time in
depositional regimes (i.e., changes in depositional
environments, sediment load and/or environmental
energy flux), and are created by the interplay of base-
level changes and sedimentation. Such shifts in deposi-
tional regimes may or may not correspond to changes
in depositional trends, may or may not be associated
with stratigraphic hiatuses, and may or may not place
contrasting facies in contact across a particular surface.
The correct identification of the various types of strati-
graphic surfaces is key to the success of the sequence
stratigraphic approach, and the criteria used for such
identifications are explored in this chapter.
Stratigraphic surfaces provide the fundamental
framework for the genetic interpretation of any sedi-
mentary succession, irrespective of how one may choose
to name the packages of strata between them. For this
reason, stratigraphic surfaces in conjunction with
shoreline trajectories, which are core concepts inde-
pendent of the sequence stratigraphic model of choice,
are more important than the nomenclature of systems
tracts or even the position of sequence boundaries,
which are model-dependent (Fig. 1.7). Across the spectrum
of existing sequence stratigraphic models, the signifi-
cance of stratigraphic surfaces may change from
sequence boundaries to systems tract boundaries or even
within systems tract facies contacts (Figs. 1.6 and 1.7).
Stratigraphic surfaces may be identified based on a
number of criteria, including the nature of contact
(conformable or unconformable), the nature of facies
which are in contact across the surface, depositional
trends recorded by the strata below and above the
contact (forced regressive, normal regressive, or trans-
gressive), ichnological characteristics of the surface or of
the facies which are in contact across the surface, and
stratal terminations associated with each particular
surface. It can be noted that most of these criteria
involve preliminary facies analyses and an understand-
ing of the environments in which the stratigraphic
contact and the juxtaposed facies that it separates,
originated. The reconstruction of the depositional
setting therefore enables the interpreter to apply objec-
tive criteria for the recognition, correlation, and
mapping of stratigraphic surfaces.
Depending on the type of data available for analy-
sis, some contacts that separate packages of strata
characterized by contrasting stacking patterns may be
mapped solely on the basis of how strata terminate
against the contact being mapped, without independ-
ent constraints on paleodepositional environments.
This is often the case where only 2D seismic lines are
available for the preliminary screening of the subsurface
stratigraphy. In such cases, truncation, toplap, onlap,
offlap or downlap surfaces may be identified from
local to regional scales, simply based on the geometric
relationship of the underlying and/or overlying strata
with the contact that separates them. Integration of
additional data, such as 3D seismic volumes, well logs
and core, provides additional constraints on deposi-
tional setting and the genesis of stratal termination in
an environmental context, thus allowing for a proper
identification of the stratigraphic contact(s) under
investigation.
Stratigraphic surfaces may generally be classified in
environment-dependent surfaces, which have specific
environments of origin and hence a specific strati-
graphic context (e.g., surfaces of fluvial incision, trans-
gressive wave scouring, regressive wave scouring),
geometric surfaces, defined by stacking patterns and
stratal terminations (e.g., onlap surface, downlap
surface), and conceptual surfaces, which are environ-
ment-dependent and/or geometric surfaces that carry
a specific significance (e.g., systems tract or sequence
boundary) within the context of sequence strati-
graphic models (e.g., subaerial unconformities, correl-
ative conformities, maximum flooding or maximum
regressive surfaces) (Galloway, 2004). In an empirical,
rather than model-driven approach, the designation of
conceptual surfaces should only be done at the end of
a sequence stratigraphic study, once the environment-
dependent and geometric surfaces are properly identi-
fied, mapped, and tested for their chronostratigraphic
reliability. Once this observational framework is in
place, the selection of the most useful and geologically
meaningful conceptual surfaces for defining regional
genetic units, such as systems tracts and sequences, may
be performed (Galloway, 2004). The selection of concep-
tual surfaces depends on the particular circumstances of
each case study, and therefore should not follow any
rigid templates to which all data sets must conform in
order to fit the predictions of any particular model.
Stratigraphic surfaces may also be classified as a
function of their relevance to sequence stratigraphy.
Surfaces that can serve at least in part as systems tract
or sequence boundaries are sequence stratigraphic
surfaces. Depending on scope and scale of observation,
such surfaces are used to build the chronostratigraphic
framework of a sedimentary succession, from the scale
of individual depositional systems to entire basin fills.
Once this sequence stratigraphic framework is estab-
lished, additional surfaces may be traced within the
genetic units (i.e., systems tracts) bounded by
sequence stratigraphic surfaces. Such internal surfaces
have been defined as within-trend facies contacts (Embry
and Catuneanu, 2001, 2002), and help to illustrate the
patterns of facies shifts within individual systems
tracts. The following sections of this chapter present
the types of stratal terminations that are used to inter-
pret geometric surfaces and associated depositional
trends and shoreline trajectories, followed by a discus-
sion of all types of stratigraphic surfaces that have
relevance to sequence stratigraphy.
TYPES OF STRATAL TERMINATIONS
Stratal terminations are defined by the geometric rela-
tionship between strata and the stratigraphic surface
against which they terminate, and are best observed at
larger scales, particularly on 2D seismic lines and in
large-scale outcrops (Figs. 2.65, 2.68, 2.69, and 3.22). The
main types of stratal terminations are described by trun-
cation, toplap, onlap, downlap, and offlap (Fig. 4.1).
Excepting for truncation, which is a term stemming
from classical geology, the other concepts have been
introduced with the development of seismic stratigra-
phy in the 1970s to define the architecture of seismic
reflections (Mitchum and Vail, 1977; Mitchum et al.,
1977). These terms have subsequently been incorpo-
rated into sequence stratigraphy in order to describe the
stacking patterns of stratal units and to provide criteria
for the recognition of the various surfaces and systems
tracts (e.g., Posamentier et al., 1988; Van Wagoner et al.,
1988; Christie-Blick, 1991). The definitions of the key
types of stratal terminations are provided in Fig. 4.2.
Stratal terminations form in relation to specific
depositional trends, and therefore allow one to infer
the type of syndepositional shoreline shifts and implic-
itly to reconstruct the history of base-level changes at
the shoreline (Fig. 4.3). In some instances, the interpre-
tation of stratal terminations in terms of shoreline
shifts is unequivocal, as for example coastal onlap indi-
cates transgression, and offlap is diagnostic for forced
regressions. In other cases, stratal terminations may
allow for alternative interpretations, as for example
downlap may form in relation to either normal or forced
regressions. In such cases, additional criteria have to
be used in order to cut down the number of choices
and arrive at unequivocal conclusions. In this exam-
ple, the differentiation between normal and forced
regressions that can be associated with downlap may be
performed by studying the depositional trends (aggra-
dation or erosion) in the syndepositional coastal
setting. Evidence of scouring, as indicated by an uneven
erosional relief, lag deposits, or the presence of offlap at
the top of the prograding package would point towards
forced regression, whereas coastal aggradation would
suggest base-level rise and hence normal regression.
The process of coastal aggradation during normal
regressions results in the formation of topset packages
of delta plain (in a prograding river-mouth environ-
ment; Figs. 2.3 and 2.4), strandplain (a wide beach
characterized by subparallel ridges and swales, in
places with associated dunes, which forms by processes
106 4. STRATIGRAPHIC SURFACES
Truncation
Toplap
Downlap
Onlap
Downlap
Downlap
Offlap
Onlap
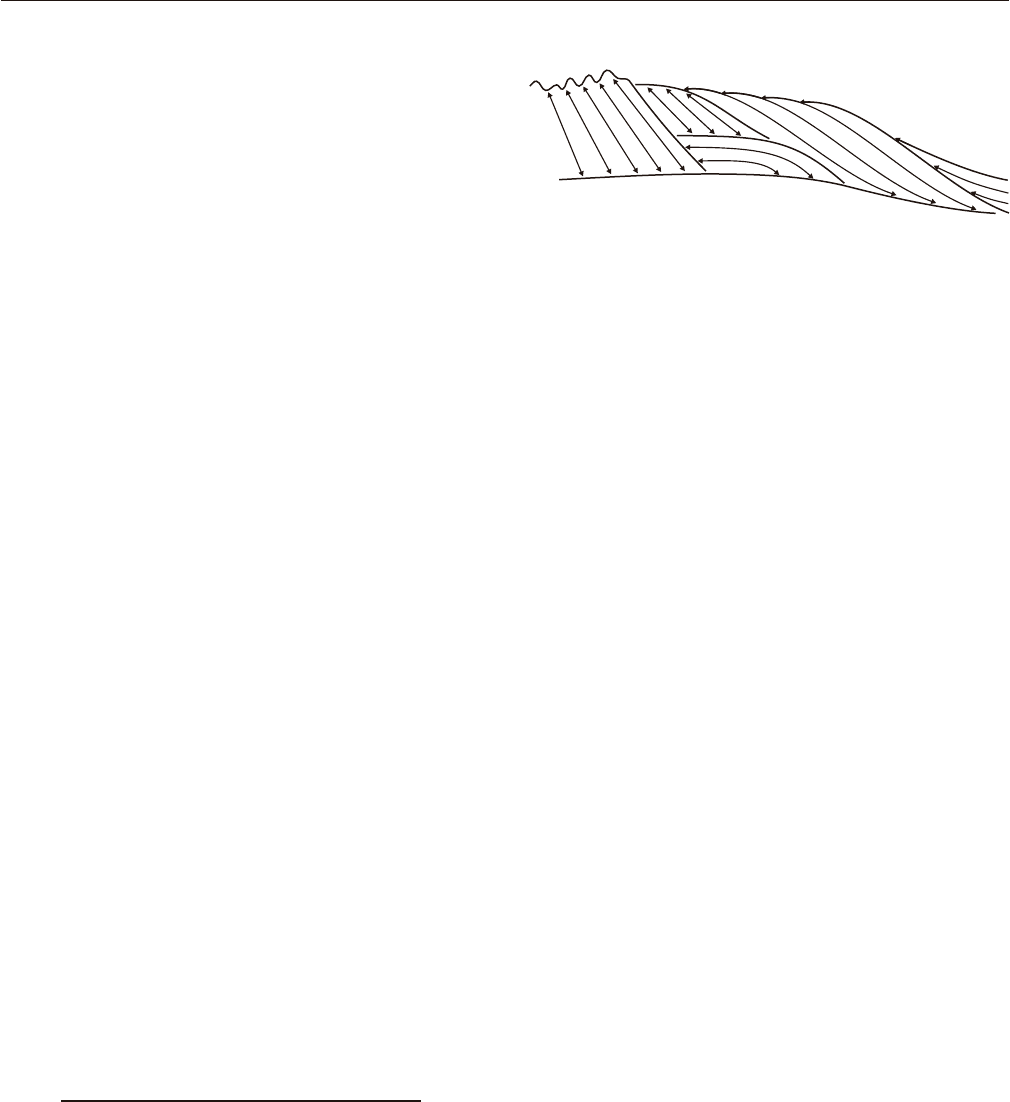
FIGURE 4.1 Types of stratal terminations (modified from Emery
and Myers, 1996). Note that tectonic tilt may cause confusion
between onlap and downlap, due to the change in ratio between the
dip of the strata and the dip of the stratigraphic surface against
which they terminate.

of coastal aggradation and progradation in an open
shoreline setting; Figs. 2.3 and 2.4) and/or coastal plain
deposits (Fig. 2.5). The topset is not a type of stratal
termination, but rather a unit consisting of nearly hori-
zontal layers of sediments deposited on the top surface
of a prograding coastline, which covers the edge of
the seaward-lying foreset beds and is continuous with
the landward alluvial plain (Bates and Jackson, 1987).
The thickness of the topset package depends on the
duration of normal regression, and the rates of base-
level rise and sediment supply. The concept of toplap,
as a stratal termination that forms in relation to a regres-
sive coastline during base-level stillstand (i.e., neither
normal nor forced regression; Fig. 4.3) is, in reality,
often associated with the formation of topsets, espe-
cially where the topset thickness is less than the verti-
cal seismic resolution. Ideally, the formation of toplap
requires progradation of foreset beds (delta front or
shoreface clinoforms) coeval with perfect sediment
bypass in the coastal environments (delta plain,
strandplain, or coastal plain). This means an ideal case
where the base level at the shoreline does not change
with time, as a base-level rise would result in topset,
and a base-level fall would result in offlap. Such a situ-
ation may only happen for relatively short periods of
time, as the base level (controlled by the interplay of
several independent factors) is hardly, if ever, stable.
The concept of toplap was developed from the analysis
of seismic data, where the thickness of topset packages
often falls below the seismic resolution, being reduced
to a seismic interface. The toplap type of stratal termi-
nations is therefore apparent in most cases (Fig. 4.4).
Apparent toplaps may also develop during stages of
base-level fall (forced regressions) associated with
minimum erosion, where the evidence for erosion is
undetectable on seismic lines (Fig. 4.3).
TYPES OF STRATAL TERMINATIONS 107
Truncation: termination of strata against an overlying erosional surface. Toplap may develop
into truncation, but truncation is more extreme than toplap and implies either the development
of erosional relief or the development of an angular unconformity.
Toplap: termination of inclined strata (clinoforms) against an overlying lower angle surface,
mainly as a result of nondeposition (sediment bypass), ± minor erosion. Strata lap out in a
landward direction at the top of the unit, but the successive terminations lie progressively
seaward. The toplap surface represents the proximal depositional limit of the sedimentary unit.
In seismic stratigraphy, the topset of a deltaic system (delta plain deposits) may be too thin to
be “seen” on the seismic profiles as a separate unit (thickness below the seismic resolution). In
this case, the topset may be confused with toplap (i.e., apparent toplap).
Onlap: termination of low-angle strata against a steeper stratigraphic surface. Onlap may also
be referred to as lapout, and marks the lateral termination of a sedimentary unit at its
depositional limit. Onlap type of stratal terminations may develop in marine, coastal, and
nonmarine settings:
Downlap: termination of inclined strata against a lower-angle surface. Downlap may also be
referred to as baselap, and marks the base of a sedimentary unit at its depositional limit.
Downlap is commonly seen at the base of prograding clinoforms, either in shallow-marine or
deep-marine environments. It is uncommon to generate downlap in nonmarine settings,
excepting for lacustrine environments. Downlap therefore represents a change from marine
(or lacustrine) slope deposition to marine (or lacustrine) condensation or nondeposition.
Offlap: the progressive offshore shift of the updip terminations of the sedimentary units within
a conformable sequence of rocks in which each successively younger unit leaves exposed a
portion of the older unit on which it lies. Offlap is the product of base-level fall, so it is
diagnostic for forced regressions.
- marine onlap: develops on continental slopes during transgressions (slope aprons,
Galloway, 1989; healing-phase deposits, Posamentier and Allen, 1993), when deep-
water transgressive strata onlap onto the maximum regressive surface.
- coastal onlap: refers to transgressive coastal to shallow-water strata onlapping onto the
transgressive (tidal, wave) ravinement surfaces.
- fluvial onlap: refers to the landward shift of the upstream end of the aggradation area
within a fluvial system during base-level rise (normal regressions and transgression),
when fluvial strata onlap onto the subaerial unconformity.
FIGURE 4.2 Types of stratal termi-
nations (definitions from Mitchum,
1977; Galloway, 1989; Emery and
Myers, 1996).
In terms of the inferred relationship between stack-
ing patterns and base-level changes, some stratal
terminations are generally considered to form only
during stages of base-level rise (i.e., all types of onlap),
some are specific for a falling base level (e.g., fluvial
incision/truncation and offlap), whereas others may
be associated with either falling or rising base level
(i.e., truncation related to processes of marine erosion,
apparent toplap, or downlap) (Fig. 4.3). Exceptions to
these general rules are, however, known to occur, as
for example fluvial incision may also take place during
stages of base-level rise and transgression (Fig. 3.20).
Additional general principles may be formulated
with respect to the nature of stratigraphic surfaces
(conformable vs. unconformable) and the type of stratal
terminations recorded by the surface itself or by the
underlying and overlying strata against it. For exam-
ple, strata below a conformable surface do not termi-
nate against it, as conformities tend to parallel the
bedding of the underlying deposits, but may terminate
against a younger unconformity (i.e., truncation or
toplap). At the same time, both types of surfaces,
conformable or unconformable, may be offlapped,
onlapped, or downlapped by the strata above. As for
the stratigraphic contacts themselves, they may termi-
nate by onlap, offlap, or downlap against older strati-
graphic horizons.
A good knowledge of the tectonic and depositional
settings is often critical for the proper identification of
specific stratal terminations. For example, the marine
onlap describes deep-water gravity-flow deposits
onlapping onto the continental slope, whereas fluvial
and coastal onlaps develop on continental shelves, in
nonmarine and coastal to shallow-marine environ-
ments, respectively. The differentiation between fluvial,
coastal, and marine onlap is therefore important for
paleogeographic reconstructions, and requires knowl-
edge of the types of facies that onlap onto the steeper
landscape or seafloor surfaces. Another example is
offered by truncation surfaces, which may be caused by
erosional processes in either fluvial or marine environ-
ments (Fig. 4.3). Here too, knowledge of the facies that
are in contact across the scour surface, as well as of the
overall stratal stacking patterns, are critical for the
proper identification of the truncation type. In wave-
dominated forced regressive coastal settings, truncation
is produced by wave scouring in the shallow-marine
environment as the base-level falls, and the juxtaposed
facies below and above the scour surface are both
marine in nature. In this case, the truncation surface is
downlapped by prograding forced regressive subtidal
deposits. At the same time, another erosional surface is
cut by fluvial systems adjusting to a lower-elevation
graded profile, landward relative to the shoreline
(Fig. 3.27). Truncation surfaces may also be formed by
processes of wave scouring in the subtidal environ-
ment during shoreline transgression, but this time the
scour is onlapped by ‘healing-phase’ shallow-marine
strata (coastal onlap; Fig. 3.20).
108 4. STRATIGRAPHIC SURFACES
Stratal termination
Shoreline shift Base level
Truncation, fluvial
Toplap
Offlap
Onlap, fluvial
Onlap, coastal
Onlap, marine
Downlap
FR Fall
R Stillstand
Apparent toplap NR, FR Rise, Fall
Truncation, marine
FR, T Fall, Rise
FR Fall
NR, T Rise
T Rise
T Rise
NR, FR Rise, Fall
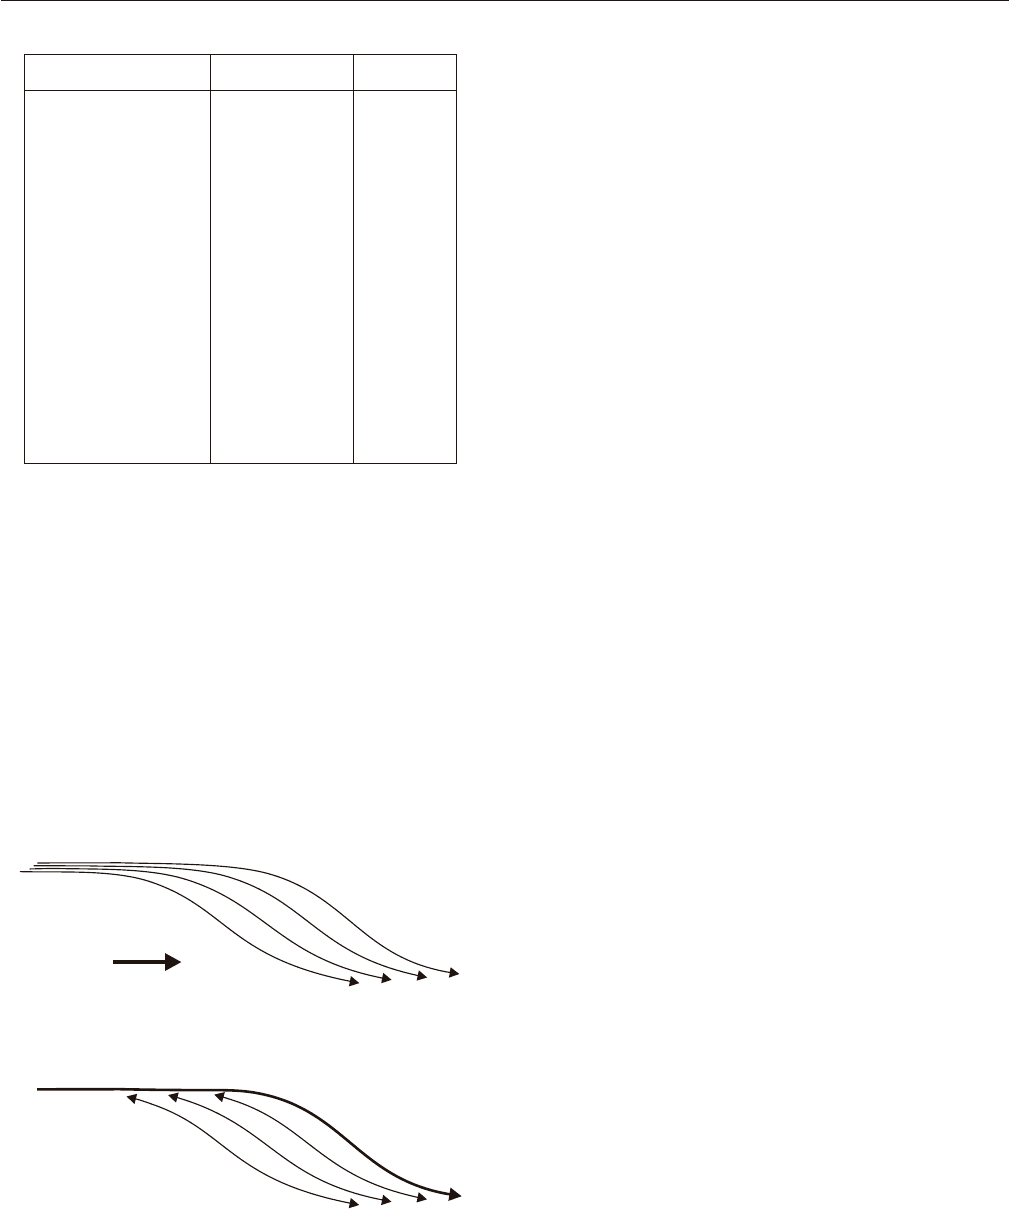
FIGURE 4.3 Interpretation of stratal terminations in terms of
syndepositional shoreline shifts and base-level changes. Exceptions
from these general trends are, however, known to occur, as for exam-
ple fluvial incision (truncation) may also take place during base-level
rise and transgression (Fig. 3.20). Abbreviations: R––regression;
FR––forced regression; NR––normal regression; T––transgression.
FIGURE 4.4 Seismic expression of a topset package that is thinner
relative to the seismic resolution. The top diagram shows the stratal
architecture of a deltaic system in a normal regressive setting. Note
the possible confusion between topset and toplap on low-resolution
seismic data.
Topset
Apparent toplap
Foreset
(clinoforms)
Foreset
(clinoforms)
PROGRADING
LOBES
SEISMIC
EXPRESSION
Downlap
Downlap

Where seismic data provide the only source of
geological information, as is often the case in frontier
hydrocarbon basins, one must be aware that most strati-
graphic units thinner than several meters, depending
on seismic resolution, are generally amalgamated
within single seismic reflections. For this reason, as
noted by Posamentier and Allen (1999), ‘… because of
limited seismic resolution, the location of stratal termi-
nations, imaged on seismic data as reflection termina-
tions, will, in general, not be located where the reflection
terminations are observed. Coastal onlap as well as
downlap terminations, in particular, can, in fact, be
located a considerable distance landward and seaward,
respectively, of where they appear on seismic data,
because of stratal thinning.’ Another potential artefact
of limited seismic resolution is that reflection geome-
tries observed on seismic transects (i.e., stratal termi-
nations as imaged on seismic data) may not always be
representative of true stratal stacking patterns. For
example, apparent onlap may be inferred on seismic lines
along which stratigraphic units drape, and not terminate
against a pre-existing topography, particularly where
the thickness of those units is less than the seismic reso-
lution (Hart, 2000; Fig. 2.42).
Postdepositional tectonic tilt may add another level
of difficulty to the recognition and interpretation of
stratal terminations, both in outcrop and on seismic
data. In particular, onlap and downlap may easily be
affected by differential subsidence or tectonic uplift,
which may change the syndepositional slope gradi-
ents of strata and of the surfaces against which they
terminate. For example, the upward motion of salt
diapirs during the evolution of a basin may modify the
original inclination of pre-existing strata, turning
depositional downlap into apparent onlap, or vice versa
(e.g., see red arrows in Fig. 2.65, which resemble onlap
geometries, but correspond in fact to depositional
downlap related to the progradation of the divergent
continental margin).
The correct interpretation of stratal terminations is
of paramount importance for the success of the
sequence stratigraphic method, as it provides critical
evidence for the reconstruction of syndepositional
shoreline shifts, and implicitly for the identification of
systems tracts and sequence stratigraphic surfaces.
Shoreline trajectories, as inferred from stratal termina-
tions and stacking patterns, are also important for
understanding sediment distribution and dispersal
systems within a sedimentary basin. This, in turn, has
important ramifications for the effort of locating facies
with specific economic significance, such as petroleum
reservoirs, coal-bearing successions, or mineral placers.
Offlapping prograding lobes, for example, are a prom-
ising ‘sign’ for the exploration of deep-water systems,
because the inferred base-level fall at the shoreline is
one of the main controls that facilitates the transfer of
coarser-grained sediment from fluvial and coastal
systems into the deep-water environment. Evidence
for normal regressions or transgressions is equally
important for designing exploration strategies,
because the depocenters for sediment accumulation,
and implicitly the distribution of economically-signifi-
cant facies, shift accordingly as a function of shoreline
trajectory, shoreline location in relation to the main
physiographic elements of the basin, available accom-
modation, and sediment supply. All these issues are
explored in more detail in the subsequent chapters of
this book.
SEQUENCE STRATIGRAPHIC
SURFACES
Surfaces that can serve, at least in part, as systems
tract or sequence boundaries, are surfaces of sequence
stratigraphic significance. Sequence stratigraphic
surfaces are defined relative to two curves; one
describing the base-level changes at the shoreline, and
one describing the associated shoreline shifts (Figs. 4.5
and 4.6). The two curves are offset relative to one
another by the duration of normal regressions, whose
timing is controlled by the interplay of base level and
sedimentation at the shoreline (Fig. 4.5). As explained
in Chapter 3, normal regressions most likely occur in
the early (‘lowstand’) and late (‘highstand’) stages of
base-level rise, when the rates of rise are very low
(starting from zero and approaching zero, respec-
tively), being outpaced by the rates of sedimentation
at the shoreline.
Base-level changes in Figs. 4.5 and 4.6 are idealized,
being defined by symmetrical sine curves. This may
not necessarily be the case in reality. Pleistocene exam-
ples from the Gulf of Mexico suggest longer stages of
base-level fall relative to base-level rise in relation to
glacio-eustatic climatic fluctuations, as it takes more
time to build ice caps (base-level fall) than to melt the
ice (Blum, 2001). The tectonic control on base-level
changes may also generate asymmetrical base-level
curves. The case study of the Western Canada foreland
system shows that stages of thrusting in the adjacent
orogen, responsible for subsidence in the foredeep,
were shorter in time relative to the stages of orogenic
quiescence that triggered isostatic rebound and uplift
in the foredeep (Catuneanu et al., 1997a). Given the
likely asymmetrical nature of the reference curve of
base-level changes, the associated transgressive–
regressive curve is bound to display an even more
SEQUENCE STRATIGRAPHIC SURFACES 109
