Carranza E. Geochemical anomaly and mineral prospectivity mapping in GIS
Подождите немного. Документ загружается.

100 Chapter 4
uni-element concentrations in the associated sample. A case example of fractal modeling
of geochemical anomalies using discrete surfaces based on stream sediment sample
catchment basins is demonstrated by Shen and Cohen (2005). So, one purpose of this
case study is to compare and contrast results of using continuous and discrete surfaces of
stream sediment uni-element concentrations in the concentration-area fractal method for
separation of background and anomaly. To ensure proper comparison and analysis of the
results, the continuous and discrete geochemical surfaces are classified uniformly using
5-percentile intervals of data distributions. For classification of the discrete geochemical
surfaces, the 5-percentile intervals are determined from the original point data values
rather than from the map (pixel) values in order to respect the empirical density
distributions of the data and because the variations in the sizes of the stream sediment
sample catchment basins (Fig. 4-11) can introduce artificial data distributions and thus
artifacts in the concentration-area relations.
Analysis of uni-element threshold values and anomalies
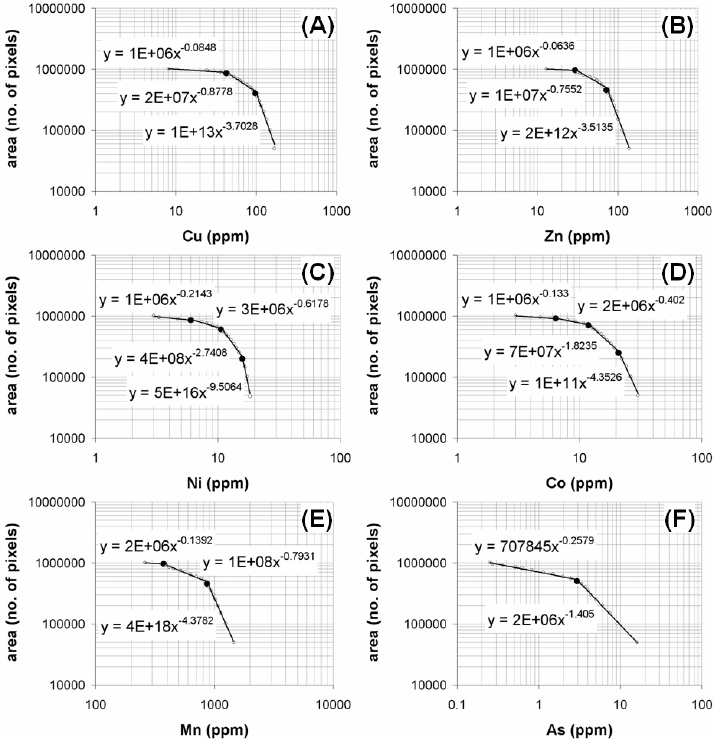
Based on the continuous geochemical surfaces, the log-log plots of the area-
concentration relations for all elements, except As, can be fitted with more than two
straight lines indicating the presence of at least three populations in the uni-element data
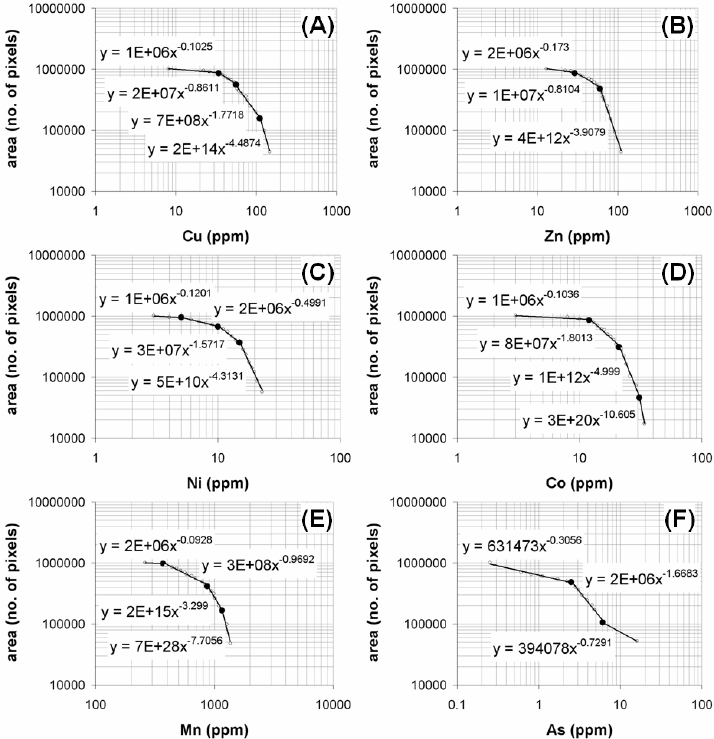
sets (Fig. 4-12). Based on the discrete geochemical surfaces, the log-log plots of the
area-concentration relations for all elements can be fitted with more than two straight
lines indicating the presence of at least three populations in the uni-element data sets
(Fig. 4-13). For each element, the log-log curves of the concentration-area plots based on
the continuous geochemical surfaces and on the discrete geochemical surfaces have very
similar shapes (Figs. 4-12 and 4-13). This suggests that, in this case study, either the
continuous geochemical surfaces or discrete geochemical surfaces can be used in the
concentration-area fractal analysis of geochemical anomalies.
The breaks in slopes of the straight lines fitted to the log-log plots of the
concentration-area relations represent thresholds that can be used to classify the uni-
element data sets into background and anomalous populations. The numbers of
thresholds defined per element based on the continuous and discrete geochemical
surfaces are equal except for Cu, Mn and As. For each of these three elements, the
number of thresholds obtained from the discrete geochemical surfaces is greater than the
number of thresholds obtained from the continuous geochemical surfaces. Nevertheless,
the values of the thresholds defined using the continuous and discrete geochemical
surfaces are closely similar (Table 4-I), especially for Zn, Ni, Mn and As, although for
each of the last two elements a third threshold and a second threshold was defined,
respectively, using the discrete geochemical surfaces. For Cu, the higher threshold based
on the continuous geochemical surface is closely similar to the highest threshold based
on the discrete geochemical surface. In addition, for Cu, the lower threshold based on the
continuous geochemical surface is roughly equivalent to the average of the lowest and
intermediate thresholds based on the discrete geochemical surface. For Co, the two
higher thresholds based on the continuous geochemical surface are respectively
Fractal Analysis of Geochemical Anomalies 101
equivalents of the two lower thresholds based on the discrete geochemical surface. The
differences in the results obtained are plausibly due to the fact that the continuous
geochemical surfaces are smoother than the discrete geochemical surfaces.
Fig. 4-12. Log-log plots of relation between areas bounded by concentration contours A(v) and
uni-element concentration values, Aroroy district (Philippines). Solid lines are obtained by least
squares fitting through linear parts of the plots. Dots at breaks in slopes of the lines represent
threshold concentrations (v
t
). Lines to the left of any threshold follow a power-law relation
represented by equation (4.6), whereas lines to the right of rightmost thresholds follow a power-
law relation represented by equation (4.7).
102 Chapter 4
Most of the ranges of uni-element concentrations based on the thresholds defined
from the analyses of the continuous and discrete geochemical surfaces are interpreted as
different levels background populations (Table 4-I). The populations in the Ni, Co and
Mn data are interpreted as different levels of background because the whole range of
Fig. 4-13. Log-log plots of relation between areas of stream sediment sample catchment basins
with uni-element concentrations above certain levels A(v) and uni-element concentration values,
Aroroy district (Philippines). Solid lines are obtained by least squares fitting through linear parts
of the plots. Dots at breaks in slopes of the lines represent threshold concentrations (v
t
). Lines to
the left of any threshold follow a power-law relation represented by equation (4.6), whereas lines
to the right of rightmost thresholds follow a power-law relation represented by equation (4.7).

Fractal Analysis of Geochemical Anomalies 103
concentrations for each of these elements is comparable to their respective average
normal abundances (or Clarke values) in the Earth’s crust (see Levinson, 1974; Rose et
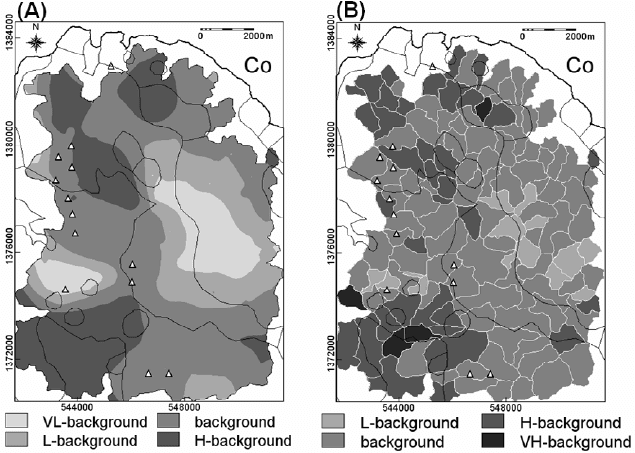
al., 1979). For example, Fig. 4-14 shows spatial distributions of different background
levels of the Co data based on thresholds defined from the analyses of the continuous
and discrete geochemical surfaces. Very low to low background Co values are mostly
distributed in areas underlain by the Aroroy Diorite (see Fig. 3-9). Background Co
values are mostly distributed in areas underlain by the Mandaon and Lanang Formations.
High to very high background Co values are mostly distributed in areas underlain by the
TABLE 4-I
Interpretations of ranges of uni-element concentrations based on thresholds* defined by
concentration-area fractal analysis of continuous surfaces and discrete sample catchment basin
surfaces of stream sediment geochemical data, Aroroy district (Philippines).
Analysis based on continuous surfaces Analysis based on discrete surfaces
Element
Concentration (in
ppm) range*
Interpretation
Concentration (in
ppm) range*
Interpretation
≤34
Low background
≤42.8
Low background 35 – 56 High background
42.9 – 97.4 High background 57 – 99 Low anomaly
Cu
>97.4 Anomaly >99 High anomaly
≤29.3
Low background
≤29
Low background
29.4 – 72.4 High background 30 – 60 High background
Zn
>72.4 Anomaly >60 Anomaly
≤6.0
Very low background
≤5
Very low background
6.1 – 10.6 Low background 6 – 10 Low background
10.7 – 15.8 Background 11 – 15 Background
Ni
>15.8 High background >15 High background
≤6.4
Very low background
6.5 – 11.8 Low background
≤12
Low background
11.8 – 20.8 Background 13 – 21 Background
>20.8 High background 21 – 31 High background
Co
>31 Very high background
≤375.9
Very low background
≤371
Very low background
376.0 – 874.5 Low background 372 – 871 Low background
>875.4 Background 872 – 1161 Background
Mn
>1161 High background
≤2.95
Background
≤2.51
Background
>2.95 Anomaly 2.52 – 6.11 Low
anomaly
As
>6.11
High anomaly
*Values in bold are thresholds defined in the log-log plots of concentration-area relations in
geochemical surfaces of the data (see Figs. 4-12 and 4-13).
104 Chapter 4
Mandaon Formation. In the southwestern portion of the area, the high (to very high)
background Co values are spatially associated with the Nabongsoran Andesite, large
outcrops of which have been observed to be intrusive into the Lanang Formation
although much smaller outcrops (not mappable at the scale of the map in Fig. 3-9) have
been observed to be intrusive into the Mandaon Formation. The high (to very high)
background Co values in the southwestern portion of the area are plausibly due to the
more mafic facies in the Nabongsoran Andesite. Similarly, the high background Co
values in the northwestern portion of the area are plausibly due to the more mafic facies
in smaller intrusive units of the Nabongsoran Andesite, which are not mappable at the
scale of the map in Fig. 3-9. However, the strong correlation of Co with Mn (see Table
3-V) suggests that the high (to very high) background Co values in the southwestern
portion of the area are also plausibly due to scavenging by co-precipitation with Mn-
oxides in the surficial environment. Note in Fig. 4-11 that the southwestern portion of
the area is characterised by topographic lows (i.e., low-energy environment), into which
westerly and southwesterly flowing streams carry their load. It is plausible that
hydromorphically dispersed elements (e.g., Co, Mn) derived from weathered rocks
Fig. 4-14. Spatial distributions of different background levels of Co in stream sediments, Aroroy
district (Philippines), based on thresholds defined from the (A) continuous surface of the Co data
and (Fig. 4-12D and Table 4-I) (B) discrete catchment basin surface of the Co data (Fig. 4-13D
and Table 4-I). VL = very low; L = low; H = high; VH = very high. Triangles represent locations
of epithermal Au deposit occurrences, whilst thin black lines represent lithologic contacts (see Fig.
3-9).
Fractal Analysis of Geochemical Anomalies 105
including the Nabongsoran Andesite precipitate in this low-energy environment resulting
in higher than background values.
Three elements (Cu, Zn, As) have ranges of uni-element concentrations, based on
the thresholds defined from the analyses of the continuous and discrete geochemical
surfaces, that are interpretable as anomalous populations (Table 4-I). For Zn, the
analyses of the continuous and discrete geochemical surfaces each resulted in
recognition of one anomalous population. For Cu and As, the analyses of the continuous
geochemical surfaces resulted in recognition of one anomalous population for each
element, whereas the analyses of the discrete geochemical surfaces resulted in
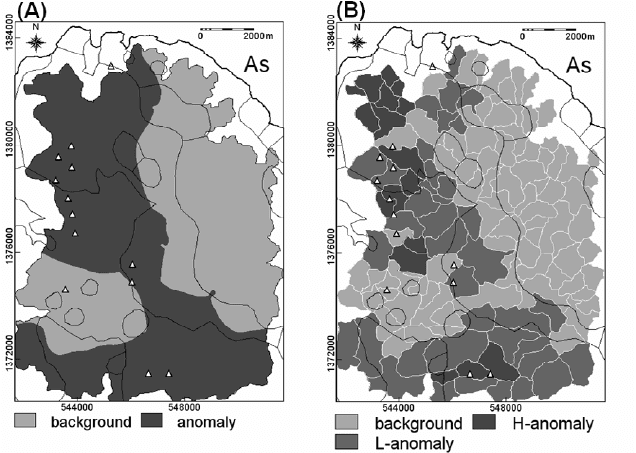
recognition of two anomalous populations for each element. The single population of As
anomalies based on the continuous geochemical surface is basically the same as the low
and high As anomalies based on the discrete geochemical surface (Fig. 4-15). Similarly,
the single population of Cu anomalies based on the continuous geochemical surface are
basically the same as the low and high Cu anomalies based on the discrete geochemical
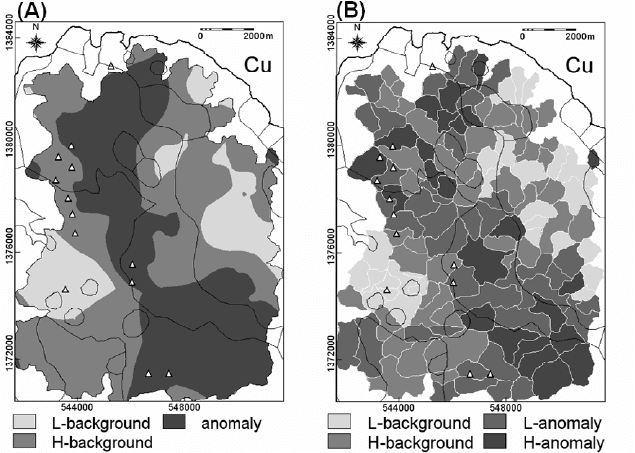
surface (Fig. 4-16). However, in the northwestern section of the area, many low and high
Cu anomalies based on the discrete geochemical surface are classified as high
background based on the continuous geochemical surface. This is attributable to the
Fig. 4-15. Spatial distributions of background and anomalous populations of As in stream
sediments, Aroroy district (Philippines), based on thresholds defined from the (A) continuous
surface of the As data (Fig. 4-12F and Table 4-I) and (B) discrete catchment basin surface of the
As data (Fig. 4-13F and Table 4-I). L = low; H = high. Triangles represent locations of epithermal
Au deposit occurrences, whilst thin black lines represent lithologic contacts (see Fig. 3-9).
106 Chapter 4
smoothing effect of the interpolation of the Cu data. Notwithstanding the slight
differences in the spatial distributions of the As and Cu based on the analyses of the
continuous and discrete geochemical surfaces, the As and Cu anomalies roughly follow
the north-northwestward trend of the Mandaon Formation (see Fig. 3-9) and have
apparent strong spatial associations with the known epithermal Au deposit occurrences.
Most of the delineated anomalies of Cu, As and Zn (not shown for this last element for
the purpose of economising space) are therefore significant anomalies. It is plausible that
some As anomalies, particularly in the southwestern section of the area (Fig. 4-15), are
false anomalies because of the moderate correlation of As with Mn (see Table 3-V),
which could be due to co-precipitation with Mn-oxides in the low-energy environment.
The spatial distributions of uni-element background and anomalous populations,
recognised via applications of the concentration-area fractal method, indicate the
presence of inter-element relationships that are explicable by the lithology and
mineralisation of the study area as well as surficial processes prevailing in the area.
These observations indicate that it is instructive to proceed to the analysis of multi-
element signatures in the geochemical data.
Fig. 4-16. Spatial distributions of background and anomalous populations of Cu in stream
sediments, Aroroy district (Philippines), based on thresholds defined from the (A) continuous
surface of Cu data (Fig. 4-12A and Table 4-I) and (B) discrete catchment basin surface of the Cu
data (Fig. 4-13A and Table 4-I). L = low; H = high. Triangles represent locations of epithermal Au
deposits, whilst thin black lines represent lithologic contacts (see Fig. 3-9).

Fractal Analysis of Geochemical Anomalies 107
Analysis and mapping of anomalous multi-element signature
As in Chapter 3, principal components analysis (PCA) is applied to the geochemical
data prior to the generation of continuous and discrete geochemical surfaces to be used
in the concentration-area fractal analysis of multi-element anomalies. Cheng et al. (1997)
have also applied PCA to surficial sediment (till, soil and humus) geochemical data prior
to creation of geochemical contour maps used in the concentration-area fractal analysis
of multi-element anomalies. To apply PCA here, the uni-element data are log
e
-
transformed so that they approach approximately symmetrical empirical density
distributions. Because ‘complete’ catchment basin surfaces of the data are desired for
comparison with continuous geochemical surfaces, censored values for As are not
excluded in the analysis. Table 4-II shows the derived principal components (PCs),
which are similar to those obtained in Chapter 3 (see Tables 3-VII and 3-VIII). The PC3
(Cu-As) and PC4 (As-Ni) obtained here (Table 4-II) are somewhat similar to the
anomalous multi-element associations represented by PC2 (Cu-As-Ni) and PC3 (As)
shown in Table 3-VIII.
The PC3 and the PC4 obtained in the analysis here can be interpreted as follows. The
Cu-As association represented by PC3 plausibly reflects presence of mineralisation in
the area because these elements are usually enriched in sulphide (chalcopyritic and
arsenopyrtic) minerals, which generally characterise the mineralogy of epithermal Au
deposits. The As-Ni association represented by PC4 also plausibly reflects presence of
mineralisation because As is a pathfinder for many types of hydrothermal gold deposits
and Ni is probably related to dacitic/andesitic rocks that hosts the epithermal Au deposits
in the area. Thus, both PC3 and PC4 represent multi-element associations reflecting
presence of epithermal Au deposits in the area.
The slight difference in proportion of the total variance of the stream sediment uni-
element data explained by PC3 and PC4 (Table 4-II) provides insight into which of the
multi-element associations they represent is slightly more important than the other in
terms of indicating presence of epithermal Au deposits. The slightly higher proportion of
TABLE 4-II
Principal components of the log
e
-transformed stream sediment uni-element data (n=135), Aroroy
district (Philippines).
Cu Zn Ni Co Mn As
% of
Variance
Cum. % o
f
variance
PC1 0.680 0.847 0.787 0.832 0.812 0.758 62.093 62.093
PC2 0.283 -0.330 0.504 0.286 -0.428 -0.264 12.985 75.078
PC3 0.627 -0.057 -0.177 -0.363 -0.131 0.225 10.474 85.552
PC4 -0.244 -0.171 0.147 -0.045 -0.224 0.547 7.705 93.257
PC5 0.058 -0.360 -0.149 0.185 0.226 0.061 4.072 97.329
PC6 -0.026 -0.104 0.226 -0.238 0.197 -0.044 2.671 100.000
108 Chapter 4
the total variance of the stream sediment uni-element data explained by PC3 compared
to that explained by PC4 suggests that Cu-As anomalies are slightly more widely
distributed in the area than As-Ni anomalies. In addition, the magnitude of the loadings
of Cu and As on PC3 and PC4 suggests that the former is slightly mobile (thus more
dispersed) than the latter in the surficial environments of the study area. Based on these
arguments, it can hypothesised that, in terms of indicating presence of epithermal Au
mineralisation in the area, (a) the Cu-As association represented by PC3 are distal
anomalies whilst the As-Ni association represented by PC4 are proximal anomalies and,
thus, (b) the latter multi-element association (or PC4) is more important than the former
multi-element association (or PC3). Thus, the scores of PC3 and PC4 are further
subjected to the concentration-area fractal method for recognition of anomalies, although
results of analysis based on PC4 scores are explained first followed by results of analysis
based on PC3.
The scores of PC3 and PC4 for the point geochemical data are interpolated via
inverse distance moving average method to derive continuous geochemical surfaces. In
addition, the scores of PC3 and PC4 obtained here for the point geochemical data are
attributed to pixels in the associated stream sediment sample catchment basins to derive
discrete geochemical surfaces. The multi-element geochemical surfaces are discretised in
the same way the uni-element geochemical surfaces are discretised (see above). The
plots of concentration-area relations for the multi-element geochemical surfaces are
shown in Fig. 4-17. Note that the ‘concentration’ variables represented by the PC scores
do not have the normal concentration units because the PCs are linear combinations of
the log
e
-transformed uni-element data. For this reason and because negative PC scores
cannot be transformed to logarithms, the ‘concentration’ axes of the concentration-area
plots are not in the logarithmic scale. The PC scores at the breaks in slopes of the straight
lines fitted to the concentration-area relations represent thresholds that can be used to
classify the multi-element association scores into background and anomalous
populations. The very similar shapes of the concentration-area curves and the equal
numbers of thresholds defined per set of PC scores represented as continuous and
discrete geochemical surfaces (Fig. 4-17) suggest that, in this case study, either
continuous geochemical surfaces or discrete geochemical surfaces can be used in the
concentration-area fractal analysis of geochemical anomalies.
For the PC4 scores, the thresholds based on analysis of either continuous or discrete
geochemical surfaces indicate five populations, which are interpreted, from lowest to
highest, as (a) low background, (b) background, (c) high background, (d) low anomaly
and (e) high anomaly. The spatial distributions of the background and anomalous
populations of PC4 scores, representing As-Ni association in stream sediments, show
some degree of similarity (Fig. 4-18). For the PC3 scores, the thresholds based on
analysis of either continuous or discrete geochemical surfaces indicate four populations,
which are interpreted, from lowest to highest, as (a) low background, (b) high
background, (c) low anomaly and (d) high anomaly. The spatial distributions of the
background and anomalous populations of PC3 scores represented as continuous and
Fractal Analysis of Geochemical Anomalies 109
discrete surfaces show some degree of similarity (Fig. 4-19). The low and high
anomalies based on analysis of the continuous surface of PC3 scores show weaker
spatial association with the epithermal Au deposit occurrences compared to the low and
high anomalies based on analysis of the discrete surface of PC3 scores. This indicates
that spatial interpolation of stream sediment geochemical data potentially results in loss
of important geo-information due to smoothing of the data.
The low and high anomalies of the As-Ni association based on analysis of the
continuous and discrete surfaces of PC4 scores (Fig. 4-18) show stronger spatial
associations with the epithermal Au deposit occurrences compared to the low and high
anomalies of the Cu-As association based on analysis of either continuous or discrete
surface of PC3 scores (Fig. 4-19). This indicates that most of the low and high anomalies
of PC4 scores are significant, whereas most of the low and high anomalies of PC3 scores
are not. Nevertheless, some low and high anomalies of PC3 scores (Fig. 4-19) are
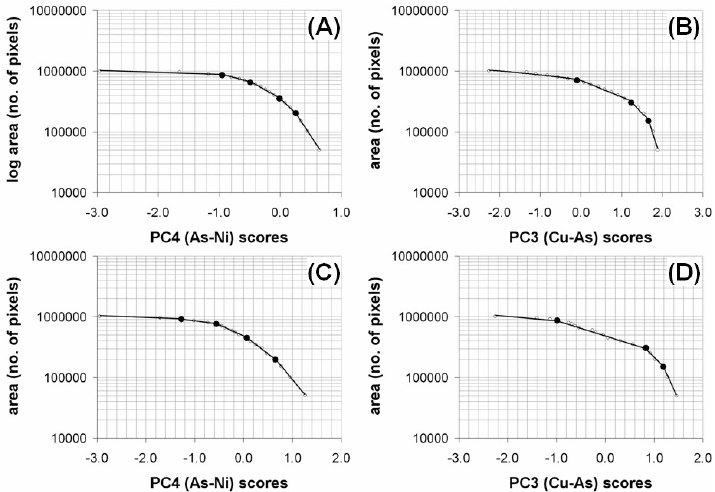
Fig. 4-17. Concentration-area models for PC4 and PC3 scores of the stream sediment geochemical
data (Table 4-II), Aroroy district (Philippines), based on their [(A) and (B), respectively]
transformations into continuous geochemical surfaces and [(C) and (D), respectively]
representations as discrete geochemical surfaces. Solid lines are obtained by least squares fitting
through linear parts of the plots. Dots at breaks in slopes of the lines represent threshold PC scores
(v
t
). Lines to the left of any threshold follow a power-law relation represented by equation (4.6),
whereas lines to the right of rightmost thresholds follow a power-law relation represented by
equation (4.7).