Blake A.J.(ed.) Crystal Structure Analysis
Подождите немного. Документ загружается.

252 Powder diffraction
become essential when phenomena such as phase transitions cause sin-
gle crystals to shatter under working conditions. Recent advances in the
speed of powder diffraction studies (whole patterns being collected in
a matter of minutes, seconds or less) using advanced sources/detectors
mean that phenomena such as host-guest inclusion reactions, chemical
transformations in the solid state and crystallization can now be fol-
lowed in real time, allowing valuable kinetic and mechanistic insight
into the process of chemical transformations (Evans and Evans, 2004).
Despite powder diffraction being seen as a ‘poor cousin’ to single-crystal
techniques by many, it is a key member of the family of analyti-
cal methods that can be brought to bear on understanding structural
problems. This chapter highlights areas of potential interest to the small-
molecule community; for more in-depth and mathematical descriptions
of powder diffraction the reader should look elsewhere (Klug and
Alexander, 1974; Jenkins and Snyder, 1996; Cullity and Stock, 2001;
Pecharsky and Zavalij, 2003; Dinnebier and Billinge, 2008). Specialist
schools on structural and magnetic Rietveld refinement are organised
biennially by the Physical Crystallography Group of the BCA (see
www.crystallography.org.uk).
17.2 Powder versus single-crystal diffraction
In a conventional single-crystal experiment a beam of monochromatic
X-rays/neutrons is incident on a suitably mounted and oriented sin-
gle crystal. The phenomenon of diffraction leads to diffracted beams
being produced in certain directions in space (see earlier chapters). The
positions and intensities of these beams are recorded by film, point-
detector or (most commonly nowadays) area-detector methods. After
crystal selection and data collection the analysis is usually broken down
into four essentially separate stages that are described in detail in other
chapters:
1. indexing to find the unit cell;
2. integration of raw images to produce a single data file listing
intensities and hkl values for each reflection;
3. structure solution (typically by direct methods or Patterson
synthesis);
4. structure completion and refinement.
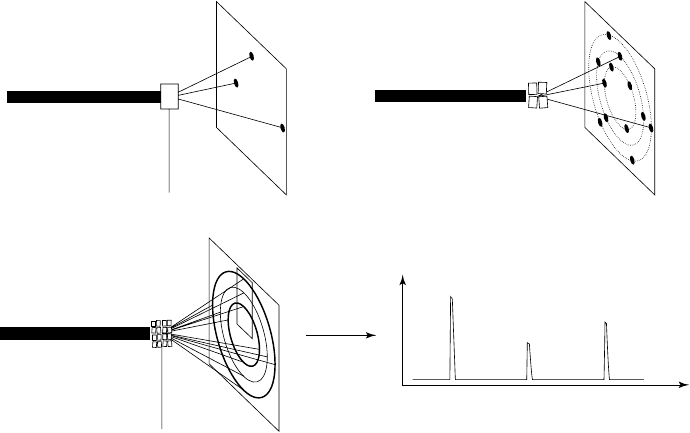
In a powder experiment (Fig. 17.1), instead of a single crystal one has a
collection of randomly oriented polycrystallites exposed to the beam.
Each of these polycrystallites can be thought of as giving rise to its
own diffraction pattern, and individual ‘spots’ on a film become spread
out into rings of diffracted intensity (these rings are the intersections
of cones of diffracted intensity with the film). The intensity of these
rings can be recorded using film/area-detector methods, but are most
commonly measured by scanning a point detector or 1D line detec-
tor across a narrow strip of the rings. In either case one can represent

17.2 Powder versus single-crystal diffraction 253
(a) (b)
(c) (d)
2-theta
l
Fig. 17.1 (a) shows diffraction from an oriented single crystal, (b) from a collection of 4 crystals at different orientations with respect
to the incident beam and (c) from a polycrystalline material. (d) shows the resulting I versus 2θ plot obtained by scanning across the
outlined rectangle of (c).
the diffraction data as a plot of total diffracted intensity against the
diffraction angle 2θ .
Figure 17.1 immediately shows one of the inherent problems of
powder diffraction. The 3D intensity distribution of a single-crystal
experiment is compressed into the one dimension of 2θ space, lead-
ing to a vast loss of information due to peak overlap. In a metrically
cubic crystal, for example, interplanar spacings are given by d
hkl
=
a/(h
2
+k
2
+l
2
)
1/2
. The (221) and (300) reflections(which will in general be
of different intensity) will occur at identical values of 2θ and only infor-
mation on their summed intensity is available from a powder diffraction
experiment. For cells of lower symmetry one may get accidental over-
lap (partial or complete) of different hkl reflections. For a triclinic cell of
the complexity that would be routine for modern single-crystal meth-
ods (3400 Å
3
), using a typical laboratory powder diffractometer with
λ = 1.54 Å there would be ∼5500 reflections predicted between 0 and
90
◦
2θ(d
min
= 1.09 Å). Even for a highly crystalline material this will
lead to a considerable degree of peak overlap (Sivia, 2000; David, 1999).
In order to minimize the effects of peak overlap it is important to choose
an experimental setup (see Section 17.3) that gives peak widths that are
as sharp as possible. In powder diffraction this is referred to as a ‘high-
resolution’ experiment. Note that this is a different meaning from that
typically implied in single-crystal studies (data recorded to high sin θ/λ
to allow high resolution in Fourier maps).
254 Powder diffraction
There are a number of methods that attempt to alleviate overlap
problems. In one approach some independent information regarding
overlapping peaks can be retrieved from intensity variations around the
Debye–Scherrer rings of deliberately textured samples (Wessels et al.,
1999); in another one can make use of anisotropic thermal expansion
to try to resolve different families of reflections at different tempera-
tures. In the absence of such methods, overlap can be minimized only
by recording the highest-resolution data attainable for a given sample.
The problems of peak overlap and the compression of 3D data into 1D
are at the heart of the differences in data analysis between single-crystal
and powder methods. Typically stages 2–4, and often stage 1, listed
abovearemergedinto oneandoneworks with the whole experimentally
recorded dataset throughout. The need for high resolution for many
experiments also means that CCD detectors are not widely used, and
pointdetectors or speciallydesigned1D/2D position-sensitive detectors
are employed.
17.3 Experimental methods
There are a host of experimental methods available for recording
powder diffraction data, each with its own inherent advantages and
disadvantages. The two most commonly used geometries for obtain-
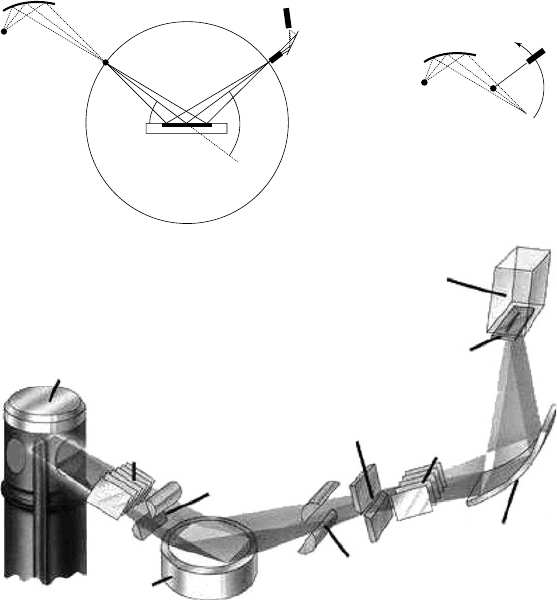
ing X-ray diffraction data in home laboratories are shown in Fig. 17.2.
In the simplest ‘reflection’ or Bragg–Brentano setup (Fig. 17.2a), one
has an X-ray line source at 3. A flat-plate sample is mounted at 4 and
a point detector at 6. The sample is scanned through an angle θ as
the detector is moved through 2θ . The most common laboratory X-
ray source is a sealed Cu tube. To produce monochromatic radiation
(CuKα
1
λ = 1.540596 Å) one can place the line source of the tube at posi-
tion 1 and a curved focusing Johannsen monochromator (e.g. Ge 111)
at position 2 to produce an effective line source at position 3. Either
a scintillation counter or a linear position-sensitive detector is com-
monly placed at position 6. This arrangement gives high resolution,
but can suffer from high backgrounds for samples that fluoresce under
Cu irradiation (e.g. Co-containing materials). Fluorescence effects can
be reduced by instead placing a monochromator between the sample
and detector. Perhaps the most common laboratory setup uses a post-
sample pyrolytic graphite monochromator at 5 and a point detector,
giving an approximately 2:1 mixture of CuKα
1
(λ = 1.540596 Å) and
Kα
2
(λ = 1.544493 Å) radiation.
It is also possible to use an energy-dispersive detector at 6 and
dispense with the monochromator altogether. Commercially available
detectors can eliminate Kβ radiation, leaving an α
1
/α
2
mix. The advan-
tage of this is that a typical monochromator is only ∼25–35% efficient,
so its omission leads to dramatic gains in intensity. In the latest gener-
ation of laboratory instruments it is common to use silicon-strip-based
linear detectors. This means that a post-sample monochromator is no

17.3 Experimental methods 255
2
1
3
X-ray tube
Soller
slit
Divergence
slit
Sample
Receiving
slit
Soller
slit
Detector
slit
Detector
(a) (b)
Antiscatter
slit
Secondary
monochromator
u
2u
4
5
1
2
3
6
Fig. 17.2 (a) and (b) Typical laboratory powder diffraction setups (see text for details).
Diagrams are not to scale; typical distances 1–3, 3–4 and 4–6 would be ∼200 mm, a sample
area of ∼100 mm
2
would be illuminated. Below: schematic 3D view of a traditional flat-
plate diffraction setup (reproduced from Philips publicity material).
longer employed and an Ni filter is placed in front of the detector to
remove most of the Kβ radiation. It should be noted that, with the high
count rates achievable, significant discontinuities in background can
be observed around strong reflections due to the absorption edge of
the filter.
There are a host of other optical components present in a typical lab-
oratory setup. Between the source and sample one uses a divergence
slit to control the area of sample illumination. To obtain quantitatively
useful intensities it is crucial that the beam remains smaller than the
sample at all angles. To help achieve this, modern instruments may
use a divergence slit that changes size with diffraction angle. This will
lead to systematic changes in peak intensity with 2θ, which must be
corrected in quantitative work. A similar antiscatter slit is often placed
between the sample and detector. To reduce the effects of axial diver-
gence, which can lead to significant peak asymmetry, Soller slits are
256 Powder diffraction
used. These are a series of thin metal plates placed in the beam paral-
lel to the plane of Fig. 17.2. For a point detector one must also select a
suitable detector slit. Each of the components in the system will influ-
ence the final peak shape in the diffraction pattern (see below), with
finer Sollers or a smaller detector slit giving a better instrumental res-
olution. Each additional component will, however, lead to a significant
loss in intensity. With a 0.05-mm detector slit one will get only
1
/
4 of
the count rate obtainable with a 0.2 mm slit. The optimal experimental
setup will be dependent on the sample, the instrument and the informa-
tion required. A typical ‘quick’ data collection covering 5−90
◦
2θ on a
conventional laboratory instrument might take 30 min, a higher-quality
scan for Rietveld refinement 12 h or more depending on the instrument
configuration. Line/area detectors may reduce these times by a factor
of 10–100.
Flat-plate samples can be prepared in a number of ways, either
as bulk powders pressed into a recessed holder or sprinkled on an
amorphous surface such as glass or (preferably) a ‘zero-background’
sample holder such as a 511-cut Si wafer. Flat-plate methods are,
however, prone to problems due to preferred orientation, whereby a
non-random arrangement of crystallites is presented to the beam. This
can severely skew diffraction intensities – in extreme cases making
experimental patterns appear completely different from calculated data
or database standards. Several methods for reducing preferred orien-
tation have been described in the literature (Klug and Alexander, 1974;
www.mluri.sari.ac.uk/commercialservices/spraydrykit.html).
The positions and intensities of reflections are also influenced by
factors such as the sample surface roughness and sample absorption
properties. For organic samples low absorption can lead to a significant
portion of the diffracted intensity occurring from below the ideal sample
surface, leading to peak shifts and broadening. Surface roughness leads
to peaks being artificially strong at high 2θ. This method of data col-
lection is therefore perhaps best suited to relatively strongly absorbing
samples or ‘quick’ qualitative measurements.
The transmission setup of Fig. 17.2b is particularly well suited for
studies on low-absorbing organic/molecular materials. Here, the sam-
ple is placed at position 2, usually mounted in a thin-walled glass
capillary of 0.2–1.0 mm internal diameter and spun in the plane of the
page (Fig. 17.3). Samples can also be mounted on thin mylar sheets.
The use of capillaries significantly reduces preferred orientation effects,
though sample mounting is slightly more time consuming. For highly
absorbing samples unusual peak shapes may also be observed, but these
can now be calculated/modelled during refinement.
As with any piece of scientific equipment, the performance of a
powder diffractometer should be regularly checked. Various standard
materials areavailable tocheck the alignment of and intensitiesrecorded
by the system (www.nist.gov). There are several commercial suppliers
of powder diffractometers, with many of the modern designs allowing
a number of different experimental configurations on the same basic

17.3 Experimental methods 257
Detector
Sample
Tube
Divergence
slits/
Sollers
Mono-
chromator
Receiving
slit
Antiscatter
slits/
Sollers
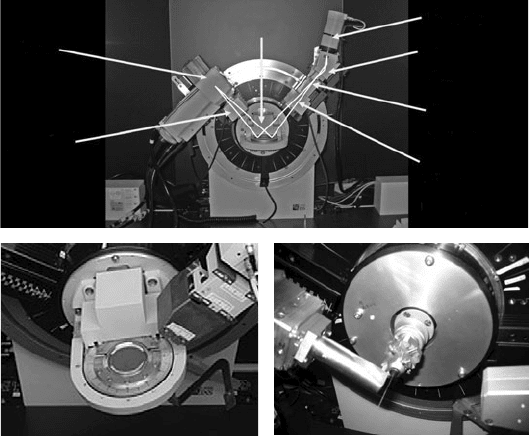
Fig. 17.3 Top: a typical laboratory instrument corresponding to the flat-plate setup of
Fig. 17.2. Bottom: flat plate and capillary holders.
instrument. The introduction of new optical devices such as X-ray mir-
rors to replace monochromators gives further flexibility in experimental
design.
Significantly higher fluxes and higher resolution is available at a syn-
chrotron source. Diffractometers such as ID31 at the ESRF and I11 at
Diamond receive a useful flux several orders of magnitude greater than
a typical laboratory instrument and can give very high-resolution data.
The range of energies emitted by a synchrotron source means that wave-
lengths can be selected for specific experiments. By selecting a short
wavelength one canobtain data tohigher values of sin θ/λwith a shorter
scan range; by choosing a longer wavelength the diffraction pattern is
spread out in 2θ, potentially allowing better resolution of overlapping
peaks. One can also select a wavelength close to an absorption edge to
tune scattering factors (resonant or near-edge experiments). It is also
possible to use the entire spectrum of radiation produced and perform
energy-dispersive diffraction. In Bragg’s law (λ = 2d
hkl
sin θ) one is then
measuring different d
hkl
values by varying λ at fixed θ rather than vary-
ing θ at fixed λ. This can allow complex experimental setups to be used,
but with current detectors gives lower-resolution data, which can also
be harder to analyze quantitatively.
Powder neutron diffraction offers significant potential advantages
over X-ray methods in some situations. In particular, since scattering
occurs from the nucleus rather than electrons, one can detect light atoms
in the presence of heavy atoms (e.g. O/H in the presence of metals). The
penetrating nature of neutrons also gives more confidence that one is
258 Powder diffraction
studying the bulk of a sample rather than a thin surface layer and allows
the use of more complex sample environment equipment. Neutrons are
also scattered by magnetic moments in a material, giving the possibility
of magnetic structure determination. Neutron diffraction can be per-
formed either at a reactor (generally using constant λ neutrons) or at a
spallation source (usually by the time-of-flight method that takes advan-
tage of the full range of neutron wavelengths produced by the source).
Perhaps the major drawback of this technique for the molecular chemist
is the fact that H scatters neutrons incoherently. To avoid unreasonably
high backgrounds it is often necessary to deuterate samples. However,
with the high fluxes available for instruments such as GEM at ISIS and
D20 at ILL (and becoming available on HRPD and at other facilities)
studies on normal hydrogenated materials are becoming increasingly
feasible.
17.4 Information contained in a
powder pattern
The powder diffraction pattern of any material (or mixture of materi-
als) contains information ‘stored’ in three distinct places. Peak positions
are determined by the size, shape and symmetry of the unit cell. Peak
intensities are determined by the arrangement of scattering density (i.e.
atomic co-ordinates) within the unit cell. The peak shape is determined
by a convolution of instrumental parameters (source, optics and detec-
tor contributions) and important information about the microstructure
(domain size, strain) of the sample. This latter information is not usually
considered in small-molecule crystallographic work, but is more notice-
able in powder analysis as peak shapes are immediately apparent when
one visualizes a dataset, and must be considered during many forms of
data analysis.
One feature that distinguishes powder diffraction from single-crystal
work is that structural analysis (i.e. the determination of fractional
co-ordinates of the atoms in the material) is not always, indeed not
normally, the goal of the experiment. The sections below describe
some of the different applications of powder diffraction. They are
arranged approximately in order of increasing complexity of anal-
ysis, and are the applications most likely to be of interest to the
small-molecule/chemistry community.
17.4.1 Phase identification
Each (crystalline) phase present in a bulk sample will give rise to a
characteristic set of peaks in a powder diffraction pattern. These can
be compared to a database of known diffraction patterns or compared
against patterns calculated from single-crystal diffraction data. Many
powder diffractometer manufacturers supply search/match software
to compare experimental datasets against the powder diffraction file
17.4 Information contained in a powder pattern 259
(PDF-2), a collection of around 186 000 (February 2007) datasets main-
tained by the International Centre for DiffractionData (www.icdd.com).
Very recently a large percentage of the Cambridge Structural Database
(Allen, 2002) (approximately 400 000 entries in February 2007) have been
made commercially available as calculated powder patterns in a for-
mat suitable for automated search/match algorithms. This so-called
PDF-4/Organics contained 312 000 entries in February 2007. Many
single-crystal refinement packages provide a facility for simulating a
diffractionpattern fromeither a refinedstructuralmodel or directlyfrom
experimental single-crystal data. These simulations can be compared
with experimental data. Many other resources for calculating powder
patterns are available via the web.
Perhaps the most important application of phase identification to the
small-molecule crystallographer is in confirming whether the powder
pattern of a bulk sample corresponds to a structure determined from a
single crystal obtained during the same synthesis – there are innumer-
able examples where the few single crystals produced in a synthesis are
due to minor products from side reactions or impurities. The presence
of crystalline co-products (e.g. KCl from a salt-elimination reaction) can
also be readily identified. A relatively quick powder diffraction experi-
ment can often shed considerable light on otherwise conflicting pieces
of analytical data.
With regard to synthesis, especially for solid-state syntheses of
extended materials, powder diffraction provides a straightforward way
of monitoring the course of reaction. Peaks due to starting materials
and other impurities can be readily identified, allowing the progress
of a reaction to be followed. In many ways powder diffraction is the
solid-state chemist’s equivalent of solution-state NMR.
17.4.2 Quantitative analysis
It is also possible to obtain quantitative information about the compo-
sition of a multiphase sample from powder diffraction data. Various
techniques have been developed based on the analysis of intensities of
individual peaks due to different phases contributing to the pattern, on
whole-pattern intensity analysis, or on multiphase Rietveld refinement
(see below). Specific details are beyond the scope of this chapter and the
reader is referred elsewhere (Dinnebier and Billinge, 2008).
It is worth noting that extreme care should be taken when deter-
mining/interpreting quantitative composition. Results can be severely
influenced by methods of sample preparation (see above), data col-
lection and analysis. Careful calibration experiments on the system of
interest are essential. It is also worth noting that it is possible to estimate
the quantity of amorphous material in a sample by powder diffraction
measurements (amorphous materials generally give rise to a gradually
oscillating contribution to the background of the diffraction pattern and
can easily be overlooked), bycarefulquantitative dilutionof a powdered
sample with an additional crystalline phase.

260 Powder diffraction
17.4.3 Peak-shape information
Whilst the position and intensity of peaks in a powder pattern are deter-
mined by the unit cell size and contents, their shape and width are
determined by both instrumental effects (which can be corrected for or
modelled) and sample properties such as the size and strain of crys-
tallites and stacking faults (Fig. 17.4) (Klug and Alexander, 1974). The
simplest expression for peak broadening due to sample size (the Scher-
rer formula) predicts that peak width and particle size are related by
fwhm = Kλ/(size × cos θ), where K is a shape factor (often 0.9), fwhm
the peak full width at half-maximum in radians, and λ the wavelength;
absolute numbers from this expression should be treated with caution.
Sample strain leads to a peak-width dependence on tan θ. Note that,
although size and strain both cause peaks to broaden with increasing
2θ, one can distinguish between these effects from their different 2θ
dependence (1/ cos θ and tan θ, respectively). This does, however, need
high-quality data recorded over a wide 2θ range. Practical guidance on
determination of sample size and strain is given in a recent IUCr Round
Robin (Balzar et al., 2004).
dL
c
d
L
c
Fig. 17.4 Size-strain.
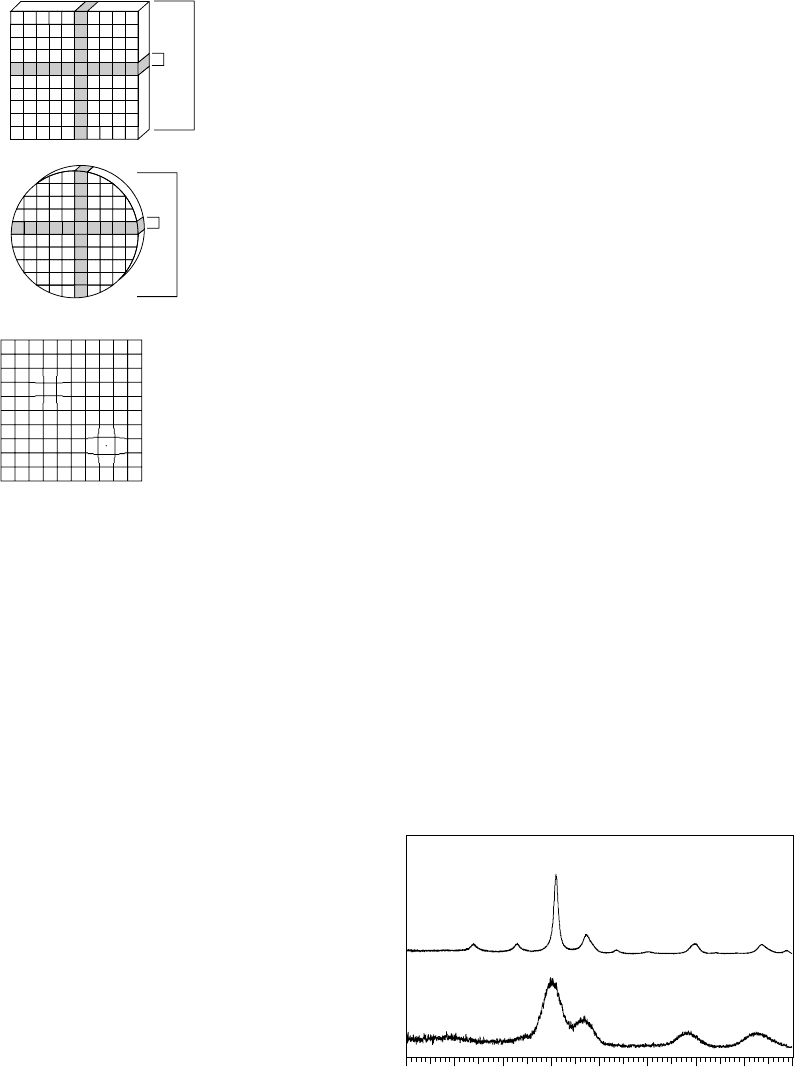
Figure 17.5 illustrates the effects of sample size on peak shapes.
Figure 17.5a shows the diffraction pattern of an FePt alloy that con-
tains ∼2.2 nm nanoparticles. Figure 17.5b shows a material with ∼8nm
domains. It is worth remembering that there are many different ways
of defining the ‘size’ of a material, and that diffraction methods report
the volume-weighted mean column height of the crystallites present.
The apparent ‘size’ of the sample is therefore dependent on the shape
of the domains (only for h00 reflections of a perfect cube is the volume-
weightedcolumnheightdirectlyrelatedto crystallite size). The apparent
size determined will also be dependent on the size distribution (often
log normal) present. If precise size information is required then support-
ing evidence from TEM/SEM is very important. In more sophisticated
treatmentshkl-dependent peak widthscan be usedto obtaininformation
Intensity
2-theta
10 20 30 40 50 60 70 80 90
(a)
(b)
Fig. 17.5 Diffraction data from (a) ∼2 nm FePt particles and (b) ∼8 nm particles.
17.5 Rietveld refinement 261
on the anisotropies of size and strain in a sample. More details on the
interpretation of peak shapes are given elsewhere (Scardi and Leoni,
2002; Warren, 1969).
17.4.4 Intensity information
The intensities of peaks in a diffraction pattern contain information
about atomic co-ordinates and displacement parameters, just as in a
single-crystal experiment. Early structural work using powder diffrac-
tion data analyzed extracted intensities (e.g. by weighing carefully
cut-out peaks in the early days!) and refinement methods essentially
identical to those used in single-crystal work. Nowadays, it is more
common to employ whole-pattern fitting methods to extract structural
information – principally the Rietveld method discussed in Section 17.5.
For any quantitative work involving powder diffraction intensities it is
essential to consider how aspects of the experimental setup (use of vari-
able slits, Lorentz-polarization factors, etc.) influence intensities. If the
data are scaled in any way (e.g. to correct for variable slits) it is important
to propagate the standard uncertainty of the intensity in an appropriate
manner.
17.5 Rietveld refinement
One of the main factors that has driven the explosion of powder diffrac-
tionmethodsinrecentyears is the popularizationoftheRietveldmethod
(Rietveld, 1969; Young, 1995; McCusker et al., 1999). In this method a
powder pattern is expressed in terms of y
obs
, the intensity observed
at a given value of 2θ . One can use a structural model (equivalent
to that used in a single-crystal refinement), a model to describe how
experimental peak shapes vary as a function of 2θ, and a model for the
background, to determine the calculated intensity, y
calc
, at each exper-
imental value of 2θ. The most commonly used function for describing
powder peaks is a pseudo-Voigt (a mixture of Gaussian and Lorentzian
contributions), though more sophisticated approaches can model peak-
shape contributions fromthe experimental setup and sample size/strain
directly.
One then typically uses a least-squares method to adjust struc-
tural parameters such as unit cell dimensions, fractional atomic co-
ordinates and displacement parameters, and instrument/experiment-
related parameters to minimize the difference between y
obs
and y
calc
over the wholeexperimental pattern (Table. 17.1). Thequality of a refine-
ment can be monitored in terms of agreement factors R
wp
or R
Bragg
or
goodness-of-fit/χ
2
(which compare the R
wp
value to the statistically
expected value R
exp
). Standard expressions for agreement factors are
given in (17.1)–(17.4); n is the number of observations, p the number of
