Anderson D.R., Sweeney D.J., Williams T.A. Essentials of Statistics for Business and Economics
Подождите немного. Документ загружается.


Appendix 2.1 Tabular and Graphical Presentations Using Minitab 75
Note that Minitab also provides the option of scaling the x-axis so that the numerical
values appear at the midpoints of the histogram rectangles. If this option is desired,
modify step 6 to include Select Midpoint for Interval Type and Enter 12:32/5 in the
Midpoint/Cutpoint positions box. These steps provide the same histogram with the
midpoints of the histogram rectangles labeled 12, 17, 22, 27, and 32.
Stem-and-Leaf Display
We use the aptitude test data in Table 2.8 to demonstrate the construction of a stem-and-leaf
display. The data are in column C1 of a Minitab worksheet. The following steps will gen-
erate the stretched stem-and-leaf display shown in Section 2.3.
Step 1. Select the Graph menu
Step 2. Choose Stem-and-Leaf
Step 3. When the Stem-and-Leaf dialog box appears:
Enter C1 in the Graph Variables box
Click OK
Scatter Diagram
We use the stereo and sound equipment store data in Table 2.12 to demonstrate the con-
struction of a scatter diagram. The weeks are numbered from 1 to 10 in column C1, the
data for number of commercials are in column C2, and the data for sales are in column C3
of a Minitab worksheet. The following steps will generate the scatter diagram shown in
Figure 2.7.
Step 1. Select the Graph menu
Step 2. Choose Scatterplot
Step 3. Select Simple and click OK
Step 4. When the Scatterplot-Simple dialog box appears:
Enter C3 under Y variables and C2 under X variables
Click OK
Crosstabulation
We use the data from Zagat’s Restaurant Review, part of which is shown in Table 2.9, to
demonstrate. The restaurants are numbered from 1 to 300 in column C1 of the Minitab
worksheet. The quality ratings are in column C2, and the meal prices are in column C3.
Minitab can only create a crosstabulation for qualitative variables and meal price is a
quantitative variable. So we need to first code the meal price data by specifying the class to
which each meal price belongs. The following steps will code the meal price data to create
four classes of meal price in column C4: $10–19, $20–29, $30–39, and $40–49.
Step 1. Select the Data menu
Step 2. Choose Code
Step 3. Choose Numerical to Text
Step 4. When the Code-Numerical to Text dialog box appears:
Enter C3 in the Code data from columns box
Enter C4 in the Store coded data in columns box
Enter 10:19 in the first Original values box and $10–19 in the adjacent
New box
Enter 20:29 in the second Original values box and $20–29 in the adjacent
New box
file
WEB
ApTest
file
WEB
Stereo
file
WEB
Restaurant
CH002.qxd 8/16/10 7:46 PM Page 75
Copyright 2010 Cengage Learning. All Rights Reserved. May not be copied, scanned, or duplicated, in whole or in part. Due to electronic rights, some third party content may be suppressed from the eBook and/or eChapter(s).
Editorial review has deemed that any suppressed content does not materially affect the overall learning experience. Cengage Learning reserves the right to remove additional content at any time if subsequent rights restrictions require it.

76 Chapter 2 Descriptive Statistics: Tabular and Graphical Presentations
Enter 30:39 in the third Original values box and $30–39 in the adjacent
New box
Enter 40:49 in the fourth Original values box and $40–49 in the adjacent
New box
Click OK
For each meal price in column C3, the associated meal price category will now appear
in column C4. We can now develop a crosstabulation for quality rating and the meal price
categories by using the data in columns C2 and C4. The following steps will create a
crosstabulation containing the same information as shown in Table 2.10.
Step 1. Select the Stat menu
Step 2. Choose Tables
Step 3. Choose Cross Tabulation and Chi-Square
Step 4. When the Cross Tabulation and Chi-Square dialog box appears:
Enter C2 in the For rows box and C4 in the For columns box
Select Counts under Display
Click OK
Appendix 2.2 Tabular and Graphical Presentations
Using Excel
Excel offers extensive capabilities for constructing tabular and graphical summaries of
data. In this appendix, we show how Excel can be used to construct a frequency distribu-
tion, bar chart, pie chart, histogram, scatter diagram, and crosstabulation. We will demon-
strate three of Excel’s most powerful tools for data analysis: chart tools, PivotChart Report,
and PivotTable Report.
Frequency Distribution and Bar Chart
for Categorical Data
In this section we show how Excel can be used to construct a frequency distribution and a
bar chart for categorical data. We illustrate each using the data on soft drink purchases in
Table 2.1.
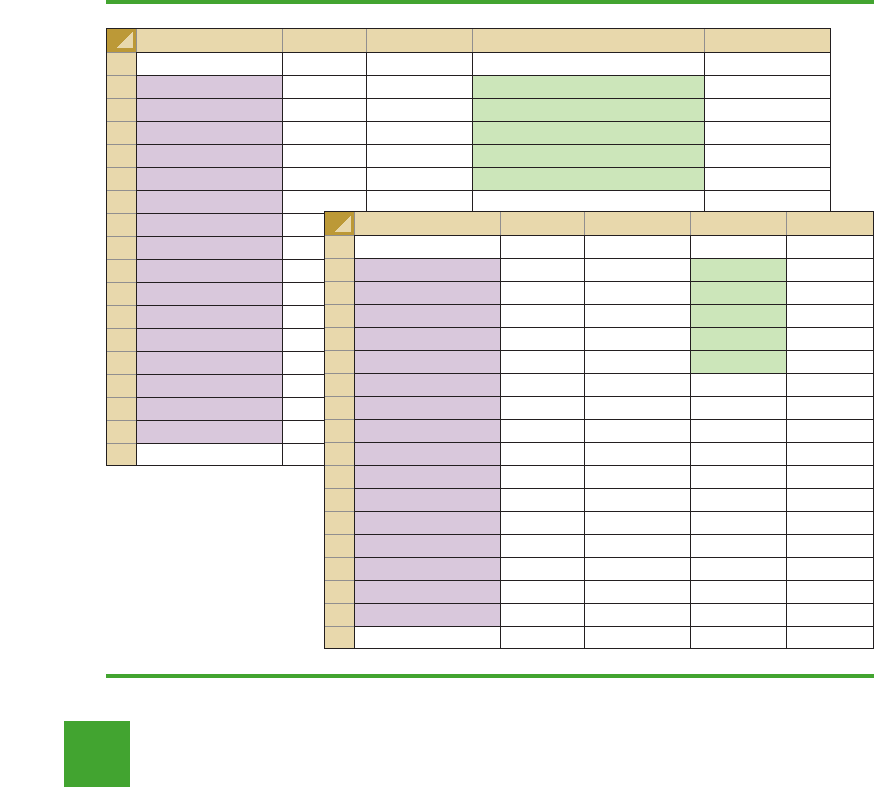
Frequency distribution We begin by showing how the COUNTIF function can be used
to construct a frequency distribution for the data in Table 2.1. Refer to Figure 2.10 as we
describe the steps involved. The formula worksheet (showing the functions and formulas
used) is set in the background, and the value worksheet (showing the results obtained using
the functions and formulas) appears in the foreground.
The label “Brand Purchased” and the data for the 50 soft drink purchases are in cells
A1:A51. We also entered the labels “Soft Drink” and “Frequency” in cells C1:D1. The five
soft drink names are entered into cells C2:C6. Excel’s COUNTIF function can now be used
to count the number of times each soft drink appears in cells A2:A51. The following steps
are used.
Step 1. Select cell D2
Step 2. Enter =COUNTIF($A$2:$A$51,C2)
Step 3. Copy cell D2 to cells D3:D6
The formula worksheet in Figure 2.10 shows the cell formulas inserted by applying
these steps. The value worksheet shows the values computed by the cell formulas. This
worksheet shows the same frequency distribution that we developed in Table 2.2.
file
WEB
SoftDrink
CH002.qxd 8/16/10 7:46 PM Page 76
Copyright 2010 Cengage Learning. All Rights Reserved. May not be copied, scanned, or duplicated, in whole or in part. Due to electronic rights, some third party content may be suppressed from the eBook and/or eChapter(s).
Editorial review has deemed that any suppressed content does not materially affect the overall learning experience. Cengage Learning reserves the right to remove additional content at any time if subsequent rights restrictions require it.
Appendix 2.2 Tabular and Graphical Presentations Using Excel 77
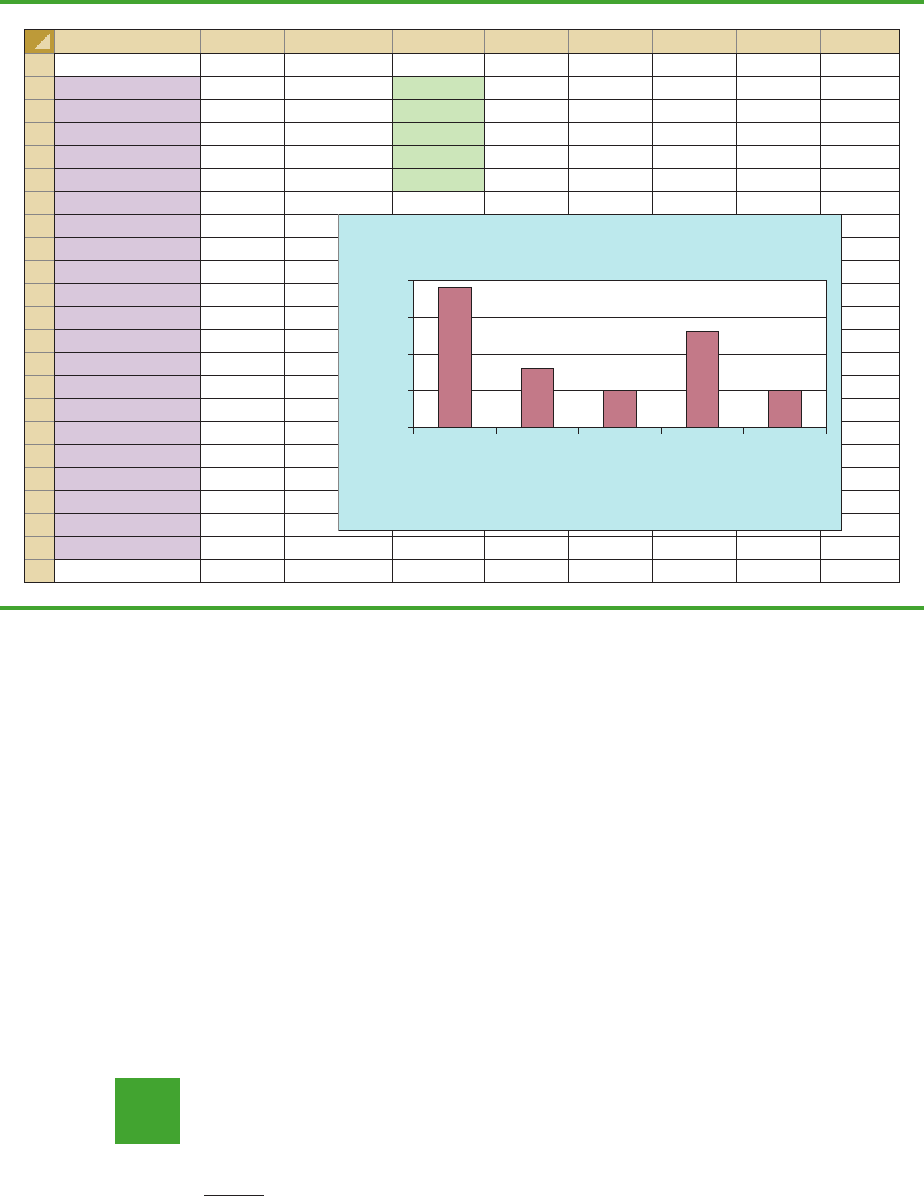
Bar chart
Here we show how Excel’s chart tools can be used to construct a bar chart for
the soft drink data. Refer to the frequency distribution shown in the value worksheet of Figure
2.10. The bar chart that we are going to develop is an extension of this worksheet. The work-
sheet and the bar chart developed are shown in Figure 2.11. The steps are as follows:
Step 1. Select cells C2:D6
Step 2. Click the Insert tab on the Ribbon
Step 3. In the Charts group, click Column
Step 4. When the list of column chart subtypes appears:
Go to the 2-D Column section
Click Clustered Column (the leftmost chart)
Step 5. In the Chart Layouts group, click the More button (the downward-pointing
arrow with a line over it) to display all the options
Step 6. Choose Layout 9
Step 7. Select the Chart Title and replace it with Bar Chart of Soft Drink Purchases
Step 8. Select the Horizontal (Category) Axis Title and replace it with Soft Drink
Step 9. Select the Vertical (Value) Axis Title and replace it with Frequency
Step 10. Right-click the Series 1 Legend Entry
Click Delete
Step 11. Right-click the vertical axis
Click Format Axis
FIGURE 2.10 FREQUENCY DISTRIBUTION FOR SOFT DRINK PURCHASES
CONSTRUCTED USING EXCEL’S COUNTIF FUNCTION
Note: Rows 11–44
are hidden.
ABC D E
1 Brand Purchased Soft Drink Frequency
2 Coke Classic Coke Classic =COUNTIF($A$2:$A$51,C2)
3 Diet Coke Diet Coke =COUNTIF($A$2:$A$51,C3)
4 Pepsi Dr. Pepper =COUNTIF($A$2:$A$51,C4)
5 Diet Coke Pepsi =COUNTIF($A$2:$A$51,C5)
6 Coke Classic Sprite =COUNTIF($A$2:$A$51,C6)
7 Coke Classic
8 Dr. Pepper
9 Diet Coke
10 Pepsi
45 Pepsi
46 Pepsi
47 Pepsi
48 Coke Classic
49 Dr. Pepper
50 Pepsi
51 Sprite
52
ABCDE
1 Brand Purchased Soft Drink Frequency
2 Coke Classic Coke Classic 19
3 Diet Coke Diet Coke 8
4 Pepsi Dr. Pepper 5
5 Diet Coke Pepsi 13
6 Coke Classic Sprite 5
7 Coke Classic
8 Dr. Pepper
9 Diet Coke
10 Pepsi
45 Pepsi
46 Pepsi
47 Pepsi
48 Coke Classic
49 Dr. Pepper
50 Pepsi
51 Sprite
52
file
W
EB
SoftDrink
CH002.qxd 8/16/10 7:46 PM Page 77
Copyright 2010 Cengage Learning. All Rights Reserved. May not be copied, scanned, or duplicated, in whole or in part. Due to electronic rights, some third party content may be suppressed from the eBook and/or eChapter(s).
Editorial review has deemed that any suppressed content does not materially affect the overall learning experience. Cengage Learning reserves the right to remove additional content at any time if subsequent rights restrictions require it.
78 Chapter 2 Descriptive Statistics: Tabular and Graphical Presentations
Step 12. When the Format Axis dialog box appears:
Go to the Axis Options section
Select Fixed for Major Unit and enter 5.0 in the corresponding box
Click Close
The resulting bar chart is shown in Figure 2.11.*
Excel can produce a pie chart for the soft drink data in a similar fashion. The major dif-
ference is that in step 3 we would click Pie in the Charts group. Several style pie charts are
available.
Frequency Distribution and Histogram
for Quantitative Data
Excel’s PivotTable Report is an interactive tool that allows you to quickly summarize data
in a variety of ways, including developing a frequency distribution for quantitative data.
Oncea frequencydistribution iscreated usingthe PivotTable Report, Excel’s chart toolscan
thenbeusedtoconstructthecorrespondinghistogram.But,usingExcel’sPivotChartReport,
we canconstruct a frequencydistribution and ahistogram simultaneously.We will illustrate
this procedure using the audit time data in Table 2.4. The label “AuditTime” and the 20 au-
dit time values areentered into cellsA1:A21of anExcel worksheet.The followingsteps de-
scribe how to use Excel’s PivotChart Report to construct a frequency distribution and a
histogram for the audit time data. Refer to Figure 2.12 as we describe the steps involved.
FIGURE 2.11 BAR CHART OF SOFT DRINK PURCHASES CONSTRUCTED USING EXCEL’S CHART TOOLS
ABCDEFGHI
1 Brand Purchased Soft Drink Frequency
2 Coke Classic Coke Classic 19
3 Diet Coke Diet Coke 8
4 Pepsi Dr. Pepper 5
5 Diet Coke Pepsi 13
6 Coke Classic Sprite 5
7 Coke Classic
8 Dr. Pepper
9 Diet Coke
10 Pepsi
11 Pepsi
12 Coke Classic
13 Dr. Pepper
14 Sprite
15 Coke Classic
16 Diet Coke
17 Coke Classic
18 Coke Classic
19 Sprite
20 Coke Classic
50 Pepsi
51 Sprite
52
Bar Chart of Soft Drink Purchases
0
5
10
15
20
Coke
Classic
SpritePepsiDr. PepperDiet Coke
Soft Drink
Frequency
*The bar chart in Figure 2.11 can be resized. Resizing an Excel chart is not difficult. First, select the chart. Sizing handles
will appear on the chart border. Click on the sizing handles and drag them to resize the figure to your preference.
In a later section of this
appendix we describe how
to use Excel’s PivotTable
Report to construct a
crosstabulation.
file
WEB
Audit
CH002.qxd 8/16/10 7:46 PM Page 78
Copyright 2010 Cengage Learning. All Rights Reserved. May not be copied, scanned, or duplicated, in whole or in part. Due to electronic rights, some third party content may be suppressed from the eBook and/or eChapter(s).
Editorial review has deemed that any suppressed content does not materially affect the overall learning experience. Cengage Learning reserves the right to remove additional content at any time if subsequent rights restrictions require it.
Appendix 2.2 Tabular and Graphical Presentations Using Excel 79
Step 1. Click the Insert tab on the Ribbon
Step 2. In the Tables group, click the word PivotTable
Step 3. Choose PivotChart from the options that appear
Step 4. When the Create PivotTable with PivotChart dialog box appears:
Choose Select a table or range
Enter A1:A21 in the Table/Range box
Choose Existing Worksheet as the location for the PivotTable and
PivotChart
Enter C1 in the Location box
Click OK
Step 5. In the PivotTable Field List, go to Choose Fields to add to report
Drag the Audit Time field to the Axis Fields (Categories) area
Drag the Audit Time field to the Values area
Step 6. Click Sum of Audit Time in the Values area
Step 7. Click Value Field Settings from the list of options that appears
Step 8. When the Value Field Settings dialog appears:
Under Summarize value field by, choose Count
Click OK
Step 9. Close the PivotTable Field List
Step 10. Right-click cell C2 in the PivotTable report or any other cell containing an
audit time
Step 11. Choose Group from the list of options that appears
Step 12. When the Grouping dialog box appears:
Enter 10 in the Starting at box
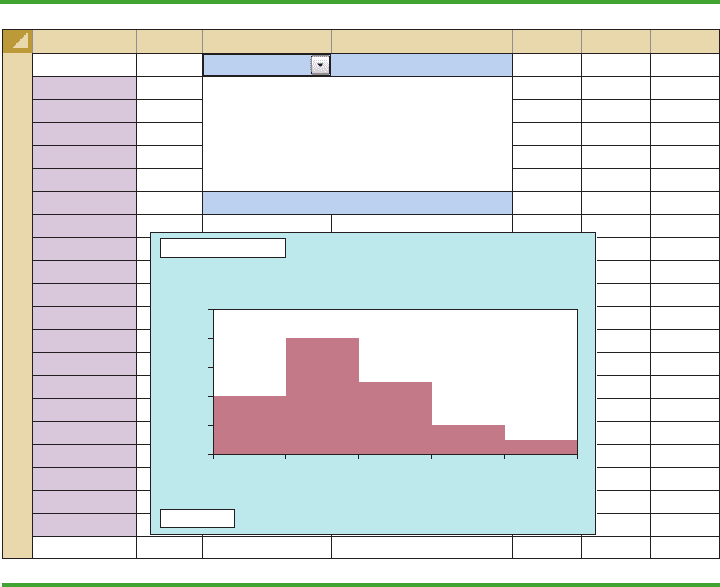
FIGURE 2.12 USING EXCEL’S PIVOTCHART REPORT TO CONSTRUCT A
FREQUENCY DISTRIBUTION AND HISTOGRAM FOR THE AUDIT
TIME DATA
AB C D EFG
1 Audit Time Row Labels Count of Audit Time
2 12 10–14 4
3 15 15–19 8
4 20 20–24 5
5 22 25–29 2
6 14 30–34 1
7 14 Grand Total 20
8 15
9 27
10 21
11 18
12 19
13 18
14 22
15 33
16 16
17 18
18 17
19 23
20 28
21 13
22
Histogram for Audit Time Data
0
2
4
6
8
10
30–3425–2920–2415–1910–14
Audit Time in Days
Frequency
Count of Audit Time
Audit Time
CH002.qxd 8/16/10 7:46 PM Page 79
Copyright 2010 Cengage Learning. All Rights Reserved. May not be copied, scanned, or duplicated, in whole or in part. Due to electronic rights, some third party content may be suppressed from the eBook and/or eChapter(s).
Editorial review has deemed that any suppressed content does not materially affect the overall learning experience. Cengage Learning reserves the right to remove additional content at any time if subsequent rights restrictions require it.
80 Chapter 2 Descriptive Statistics: Tabular and Graphical Presentations
Enter 34 in the Ending at box
Enter 5 in the By box
Click OK (a PivotChart will appear)
Step 13. Click inside the resulting PivotChart
Step 14. Click the Design tab on the Ribbon
Step 15. In the Chart Layouts group, click the More button (the downward pointing
arrow with a line over it) to display all the options
Step 16. Choose Layout 8
Step 17. Select the Chart Title and replace it with Histogram forAudit Time Data
Step 18. Select the Horizontal (Category) Axis Title and replace it with Audit Time
in Days
Step 19. Select the Vertical (Value) Axis Title and replace it with Frequency
Figure 2.12 shows the resulting PivotTable and PivotChart. We see that the PivotTable
report provides the frequency distribution for the audit time data and the PivotChart provides
the corresponding histogram. If desired, we can change the labels in any cell in the frequency
distribution by selecting the cell and entering the new label.
Crosstabulation
Excel’s PivotTable Report provides an excellent way to summarize the data for two or more
variables simultaneously. We will illustrate the use of Excel’s PivotTable Report by show-
ing how to develop a crosstabulation of quality ratings and meal prices for the sample of
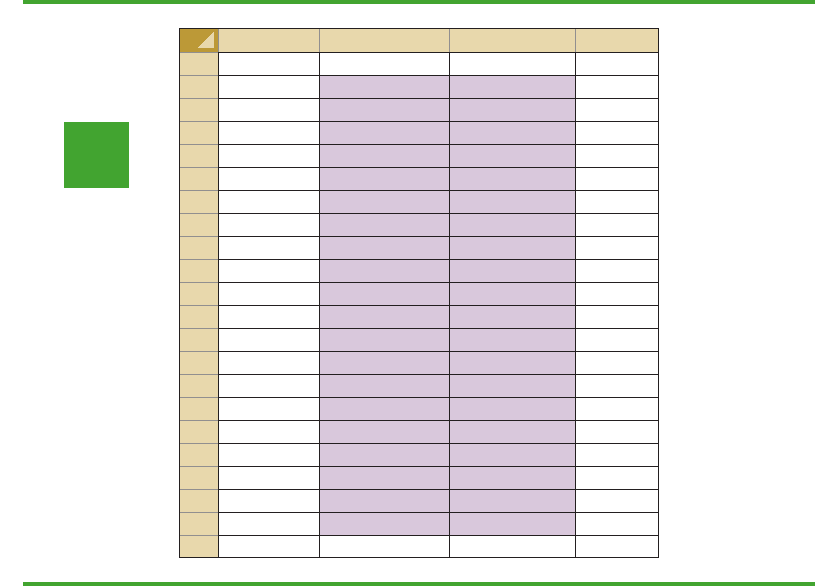
300 Los Angeles restaurants. We will use the data in the file named Restaurant; the labels
“Restaurant,” “Quality Rating,” and “Meal Price ($)” have been entered into cells A1:C1
of the worksheet as shown in Figure 2.13. The data for each of the restaurants in the sam-
ple have been entered into cells B2:C301.
FIGURE 2.13 EXCEL WORKSHEET CONTAINING RESTAURANT DATA
AB CD
1 Restaurant Quality Rating Meal Price ($)
2 1 Good 18
3 2 Very Good 22
4 3 Good 28
5 4 Excellent 38
6 5 Very Good 33
7 6 Good 28
8 7 Very Good 19
9 8 Very Good 11
10 9 Very Good 23
11 10 Good 13
292 291 Very Good 23
293 292 Very Good 24
294 293 Excellent 45
295 294 Good 14
296 295 Good 18
297 296 Good 17
298 297 Good 16
299 298 Good 15
300 299 Very Good 38
301 300 Very Good 31
302
file
W
EB
Restaurant
Note: Rows 12–291
are hidden.
CH002.qxd 8/16/10 7:46 PM Page 80
Copyright 2010 Cengage Learning. All Rights Reserved. May not be copied, scanned, or duplicated, in whole or in part. Due to electronic rights, some third party content may be suppressed from the eBook and/or eChapter(s).
Editorial review has deemed that any suppressed content does not materially affect the overall learning experience. Cengage Learning reserves the right to remove additional content at any time if subsequent rights restrictions require it.
Appendix 2.2 Tabular and Graphical Presentations Using Excel 81
In order to use the Pivot Table report to create a crosstabulation, we need to perform three
tasks: Display the Initial PivotTable Field List and PivotTable Report; Set Up the PivotTable
Field List; and Finalize the PivotTable Report. These tasks are described as follows.
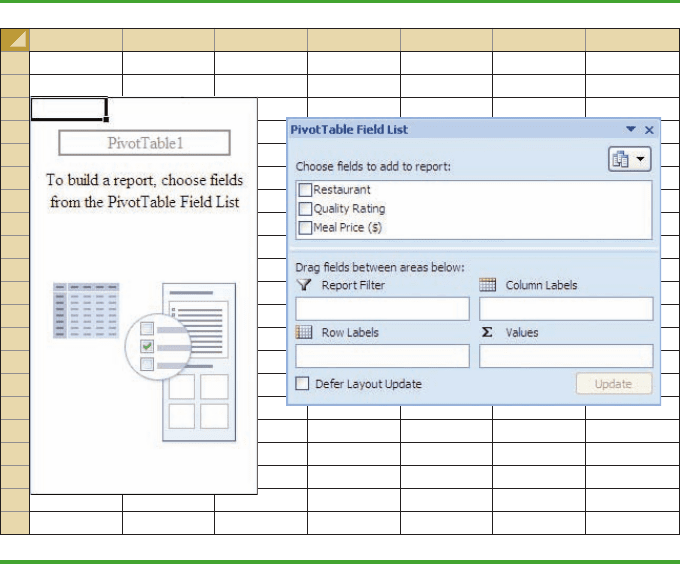
Display the Initial PivotTable Field List and PivotTable Report: The following steps
will display the initial PivotTable Field List and PivotTable report.
Step 1. Click the Insert tab on the Ribbon
Step 2. In the Tables group, click the icon above the word PivotTable
Step 3. When the Create PivotTable dialog box appears:
Choose Select a table or range
Enter A1:C301 in the Table/Range box
Choose New Worksheet as the location for the PivotTable Report
Click OK
The resulting initial PivotTable Field List and PivotTable Report are shown in Figure 2.14.
Set Up the PivotTable Field List: Each of the three columns in Figure 2.13 (labeled
Restaurant, Quality Rating, and Meal Price ($)) is considered a field by Excel. Fields may
be chosen to represent rows, columns, or values in the body of the PivotTable Report. The
following steps show how to use Excel’s PivotTable Field List to assign the Quality Rating
field to the rows, the Meal Price ($) field to the columns, and the Restaurant field to the
body of the PivotTable report.
Step 1. In the PivotTable Field List, go to Choose Fields to add to report
Drag the Quality Rating field to the Row Labels area
Drag the Meal Price ($) field to the Column Labels area
Drag the Restaurant field to the Values area
FIGURE 2.14 INITIAL PIVOTTABLE FIELD LIST AND PIVOTTABLE FIELD
REPORT FOR THE RESTAURANT DATA
ABCDEFG
1
2
3
4
5
6
7
8
9
10
11
12
13
14
15
16
17
18
19
20
21
CH002.qxd 8/16/10 7:46 PM Page 81
Copyright 2010 Cengage Learning. All Rights Reserved. May not be copied, scanned, or duplicated, in whole or in part. Due to electronic rights, some third party content may be suppressed from the eBook and/or eChapter(s).
Editorial review has deemed that any suppressed content does not materially affect the overall learning experience. Cengage Learning reserves the right to remove additional content at any time if subsequent rights restrictions require it.
82 Chapter 2 Descriptive Statistics: Tabular and Graphical Presentations
ABCDEFGALAMANAO
1
2
3 Count of Restaurant Column Labels
4 Row Labels 10 11 12 13 14 15 47 48 Grand Total
5 Excellent 1 2 2 66
6 Good 6 43324 84
7 Very Good 1 43561 1 150
8 Grand Total 7 8698523 300
9
10
11
12
13
14
15
16
17
18
19
20
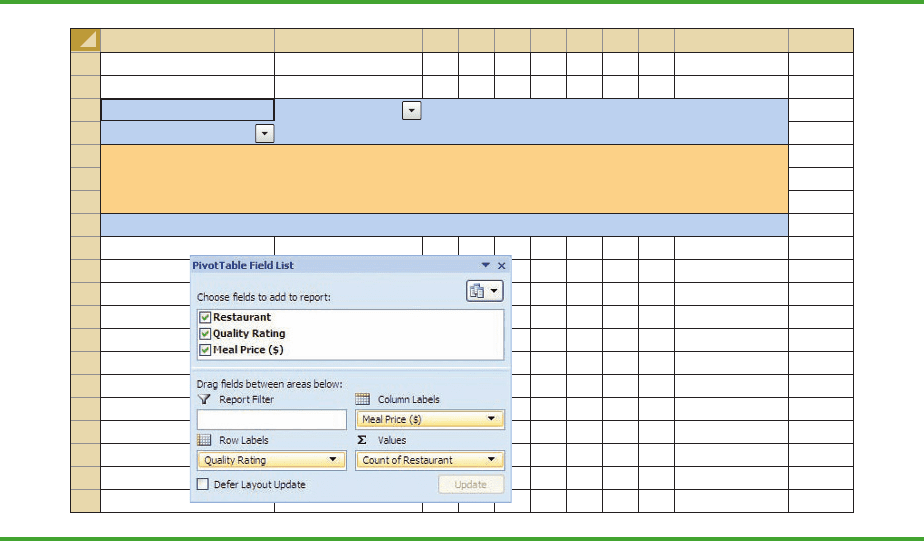
FIGURE 2.15 COMPLETED PIVOTTABLE FIELD LIST AND A PORTION OF THE PIVOTTABLE REPORT
FOR THE RESTAURANT DATA (COLUMNS H:AK ARE HIDDEN)
Step 2. Click on Sum of Restaurant in the Values area
Step 3. Click Value Field Settings from the list of options that appear
Step 4. When the Value Field Settings dialog appears:
Under Summarize value field by, choose Count
Click OK
Figure 2.15 shows the completed PivotTable Field List and a portion of the PivotTable
worksheet as it now appears.
Finalize the PivotTable Report To complete the PivotTable Report, we need to group
the columns representing meal prices and place the row labels for quality rating in the
proper order. The following steps accomplish this.
Step 1. Right-click in cell B4 or any cell containing meal prices
Step 2. Choose Group from the list of options that appears
Step 3. When the Grouping dialog box appears:
Enter 10 in the Starting at box
Enter 49 in the Ending at box
Enter 10 in the By box
Click OK
Step 4. Right-click on Excellent in cell A5
Step 5. Choose Move and click Move “Excellent” to End
The final PivotTable Report is shown in Figure 2.16. Note that it provides the same infor-
mation as the crosstabulation shown in Table 2.10.
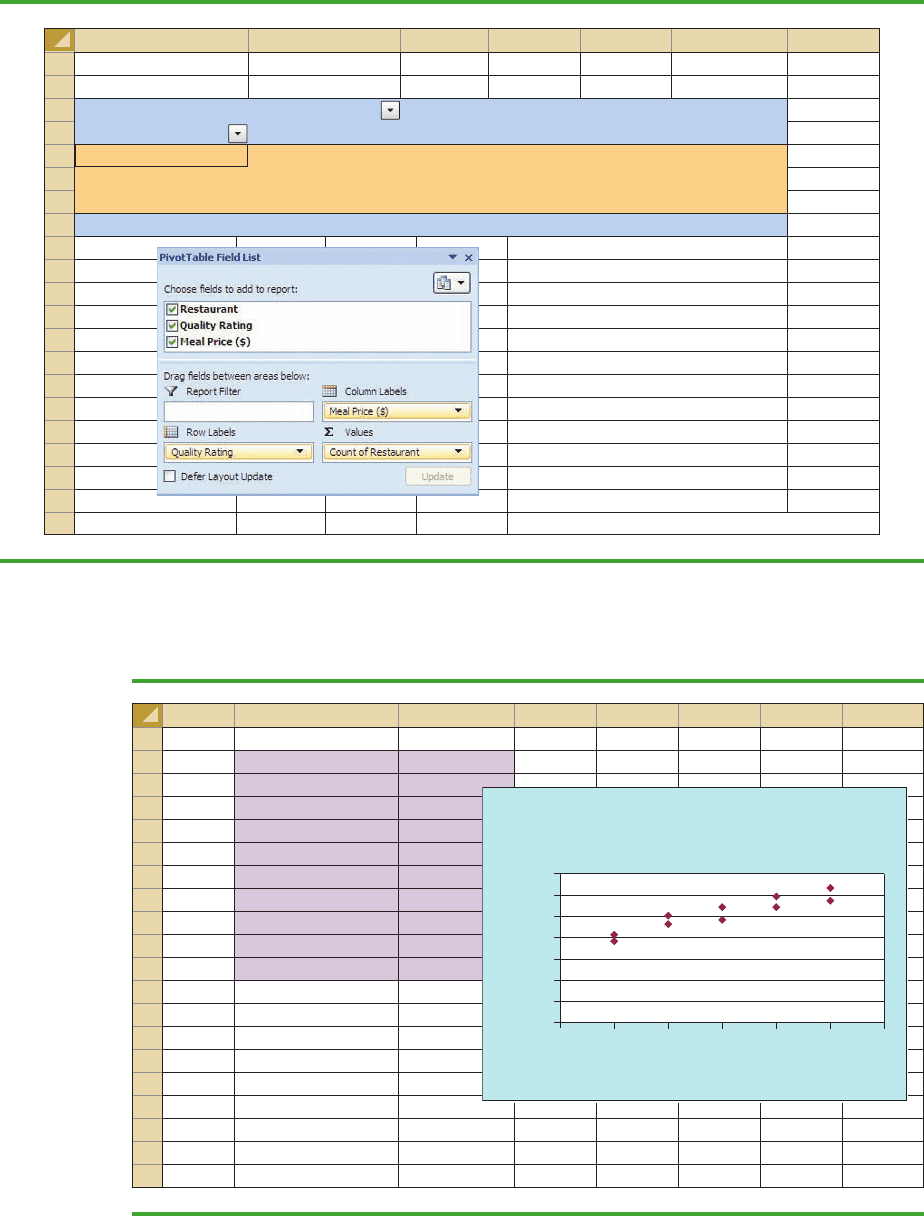
Scatter Diagram
We can use Excel’s chart tools to construct a scatter diagram and a trend line for the stereo
and sound equipment store data presented in Table 2.12. Refer to Figures 2.17 and 2.18 as
CH002.qxd 8/16/10 7:46 PM Page 82
Copyright 2010 Cengage Learning. All Rights Reserved. May not be copied, scanned, or duplicated, in whole or in part. Due to electronic rights, some third party content may be suppressed from the eBook and/or eChapter(s).
Editorial review has deemed that any suppressed content does not materially affect the overall learning experience. Cengage Learning reserves the right to remove additional content at any time if subsequent rights restrictions require it.
Appendix 2.2 Tabular and Graphical Presentations Using Excel 83
ABCDEFG
1
2
3 Count of Restaurant Column Labels
4 Row Labels 10–19 20–29 30–39 40–49 Grand Total
5 Good 42 40 2 84
6 Very Good 34 64 46 6 150
7 Excellent 2 14 28 22 66
8 Grand Total 78 118 76 28 300
9
10
11
12
13
14
15
16
17
18
19
20
21
FIGURE 2.16 FINAL PIVOTTABLE REPORT FOR THE RESTAURANT DATA
FIGURE 2.17 SCATTER DIAGRAM FOR THE STEREO AND SOUND EQUIPMENT STORE
USING EXCEL’S CHART TOOLS
AB CDEFGH
1 Week No. of Commercials Sales Volume
2 12 50
3 25 57
4 31 41
5 43 54
6 54 54
7 61 38
8 75 63
9 83 48
10 94 59
11 10 2 46
12
13
14
15
16
17
18
19
20
Scatter Diagram for the Stereo
and Sound Equipment Store
50
70
30
10
60
40
20
0
0123456
Number of Commercials
Sales ($100s)
CH002.qxd 8/16/10 7:46 PM Page 83
Copyright 2010 Cengage Learning. All Rights Reserved. May not be copied, scanned, or duplicated, in whole or in part. Due to electronic rights, some third party content may be suppressed from the eBook and/or eChapter(s).
Editorial review has deemed that any suppressed content does not materially affect the overall learning experience. Cengage Learning reserves the right to remove additional content at any time if subsequent rights restrictions require it.
84 Chapter 2 Descriptive Statistics: Tabular and Graphical Presentations
we describe the steps involved. We will use the data in the file named Stereo; the labels Week,
No. of Commercials, and Sales Volume have been entered into cells A1:C1 of the worksheet.
The data for each of the 10 weeks are entered into cells B2:C11. The following steps describe
how to use Excel’s chart tools to produce a scatter diagram for the data.
Step 1. Select cells B2:C11
Step 2. Click the Insert tab on the Ribbon
Step 3. In the Charts group, click Scatter
Step 4. When the list of scatter diagram subtypes appears, click Scatter with only
Markers (the chart in the upper left corner)
Step 5. In the Chart Layouts group, click Layout 1
Step 6. Select the Chart Title and replace it with Scatter Diagram forthe Stereo and
Sound Equipment Store
Step 7. Select the Horizontal (Value) Axis Title and replace it with Number of
Commercials
Step 8. Select the Vertical (Value) Axis Title and replace it with Sales ($100s)
Step 9. Right-click the Series 1 Legend Entry and click Delete
The worksheet displayed in Figure 2.17 shows the scatter diagram produced by Excel.
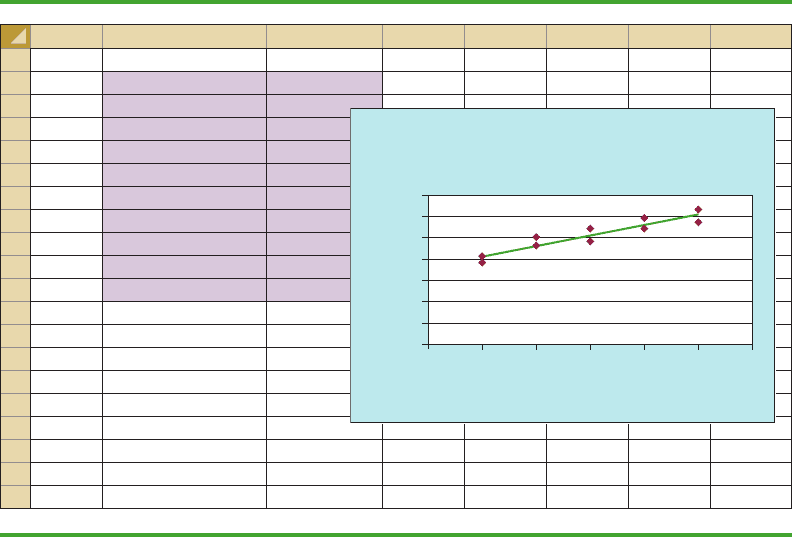
The following steps describe how to add a trendline.
Step 1. Position the mouse pointer over any data point in the scatter diagram and right-
click to display a list of options
Step 2. Choose Add Trendline
Step 3. When the Format Trendline dialog box appears:
Select Trendline Options
Choose Linear from the Trend/Regression Type list
Click Close
FIGURE 2.18 SCATTER DIAGRAM AND TRENDLINE FOR THE STEREO AND SOUND
EQUIPMENT STORE USING EXCEL’S CHART TOOLS
AB CDEFGH
1 Week No. of Commercials Sales Volume
2 12 50
3 25 57
4 31 41
5 43 54
6 54 54
7 61 38
8 75 63
9 83 48
10 94 59
11 10 2 46
12
13
14
15
16
17
18
19
20
Scatter Diagram for the Stereo
and Sound Equipment Store
50
70
30
10
60
40
20
0
0123456
Number of Commercials
Sales ($100s)
CH002.qxd 8/16/10 7:46 PM Page 84
Copyright 2010 Cengage Learning. All Rights Reserved. May not be copied, scanned, or duplicated, in whole or in part. Due to electronic rights, some third party content may be suppressed from the eBook and/or eChapter(s).
Editorial review has deemed that any suppressed content does not materially affect the overall learning experience. Cengage Learning reserves the right to remove additional content at any time if subsequent rights restrictions require it.